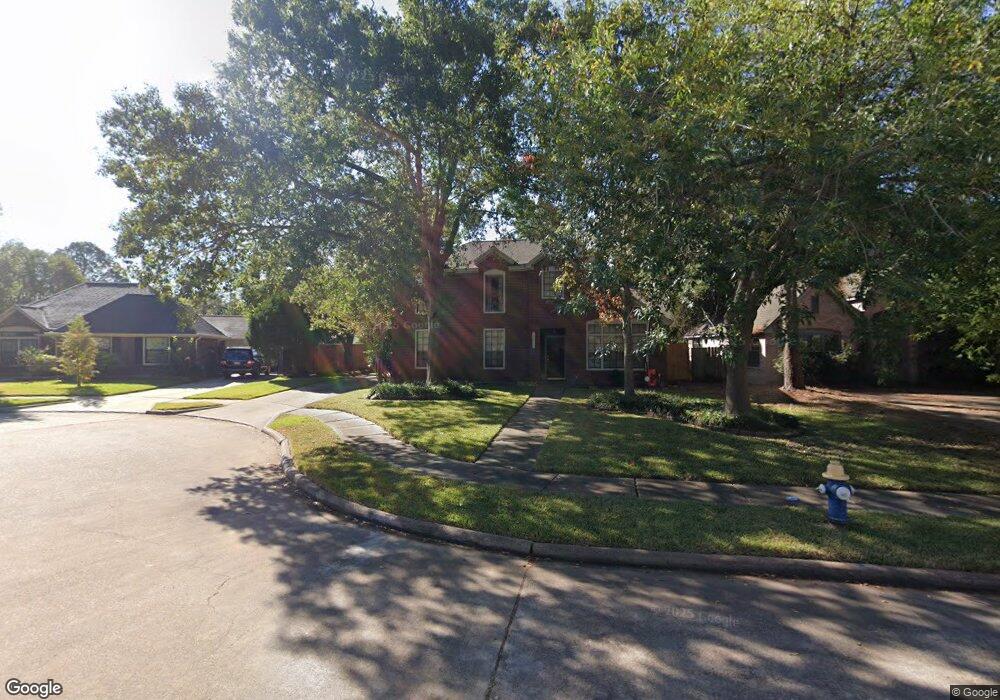
15911 Hickory Cove Dr Houston, TX 77095
Copperfield NeighborhoodEstimated Value: $326,000 - $373,000
3
Beds
3
Baths
2,335
Sq Ft
$146/Sq Ft
Est. Value
About This Home
This home is located at 15911 Hickory Cove Dr, Houston, TX 77095 and is currently estimated at $340,852, approximately $145 per square foot. 15911 Hickory Cove Dr is a home located in Harris County with nearby schools including Lowery Elementary School, Aragon Middle School, and Langham Creek High School.
Ownership History
Date
Name
Owned For
Owner Type
Purchase Details
Closed on
Jun 22, 2015
Sold by
Price Stanley and Rubar Janet Ferguson
Bought by
Cook Christopher A
Current Estimated Value
Home Financials for this Owner
Home Financials are based on the most recent Mortgage that was taken out on this home.
Original Mortgage
$181,649
Outstanding Balance
$141,292
Interest Rate
3.87%
Mortgage Type
FHA
Estimated Equity
$199,560
Purchase Details
Closed on
Jul 28, 2011
Sold by
Thornhill Susan S
Bought by
Price Stanley and Rubar Janet Ferguson
Home Financials for this Owner
Home Financials are based on the most recent Mortgage that was taken out on this home.
Original Mortgage
$192,042
Interest Rate
4.52%
Mortgage Type
VA
Purchase Details
Closed on
Aug 19, 2010
Sold by
Primacy Relocation Llc
Bought by
Thornhill Susan S
Purchase Details
Closed on
Jul 24, 2010
Sold by
Holtgrieve Kenneth R and Holtgrieve Kathy S
Bought by
Primacy Relocation Llc
Create a Home Valuation Report for This Property
The Home Valuation Report is an in-depth analysis detailing your home's value as well as a comparison with similar homes in the area
Home Values in the Area
Average Home Value in this Area
Purchase History
| Date | Buyer | Sale Price | Title Company |
|---|---|---|---|
| Cook Christopher A | -- | Startex Title Co | |
| Price Stanley | -- | Etc | |
| Thornhill Susan S | -- | Multiple | |
| Primacy Relocation Llc | -- | Texas American Title Company |
Source: Public Records
Mortgage History
| Date | Status | Borrower | Loan Amount |
|---|---|---|---|
| Open | Cook Christopher A | $181,649 | |
| Previous Owner | Price Stanley | $192,042 |
Source: Public Records
Tax History Compared to Growth
Tax History
| Year | Tax Paid | Tax Assessment Tax Assessment Total Assessment is a certain percentage of the fair market value that is determined by local assessors to be the total taxable value of land and additions on the property. | Land | Improvement |
|---|---|---|---|---|
| 2025 | $4,367 | $334,300 | $61,025 | $273,275 |
| 2024 | $4,367 | $323,070 | $61,025 | $262,045 |
| 2023 | $4,367 | $339,868 | $61,025 | $278,843 |
| 2022 | $6,219 | $313,052 | $40,683 | $272,369 |
| 2021 | $5,956 | $256,568 | $40,683 | $215,885 |
| 2020 | $5,829 | $263,084 | $31,257 | $231,827 |
| 2019 | $5,484 | $231,947 | $27,536 | $204,411 |
| 2018 | $1,967 | $202,000 | $27,536 | $174,464 |
| 2017 | $4,633 | $202,000 | $27,536 | $174,464 |
| 2016 | $4,753 | $207,229 | $27,536 | $179,693 |
| 2015 | $3,348 | $192,965 | $27,536 | $165,429 |
| 2014 | $3,348 | $179,843 | $23,071 | $156,772 |
Source: Public Records
Map
Nearby Homes
- 16030 Royal Garden Dr
- 16026 Autumn Falls Ln
- 16114 Kintyre Point Rd
- 15854 Knolls Lodge Dr
- 16215 Cairngorm Ave
- 16215 Wemyss Bay Rd
- 15918 Pinyon Creek Dr
- 16319 Chimneystone Dr
- 16315 Battlecreek Dr
- 7719 Woodlett Ct
- 8203 Green Devon Dr
- 15810 Knoll Lake Dr
- 8526 Hot Springs Dr
- 16502 Rainbow Lake Rd
- 7511 Marble Glen Ln
- 7731 Club Lake Dr
- 8306 Lake Crystal Dr
- 8426 Laurel Trails Dr
- 7419 Foxton Place Ct
- 7414 Starbridge Dr
- 15915 Hickory Cove Dr
- 15907 Hickory Cove Dr
- 15919 Hickory Cove Dr
- 15903 Hickory Cove Dr
- 15910 Hickory Cove Dr
- 15914 Hickory Cove Dr
- 15906 Hickory Cove Dr
- 15950 Knolls Lodge Dr
- 15954 Knolls Lodge Dr
- 7707 Knolls Lodge Ct
- 15958 Knolls Lodge Dr
- 7703 Knolls Lodge Ct
- 7711 Knolls Lodge Ct
- 15962 Knolls Lodge Dr
- 16006 Royal Garden Dr
- 16010 Royal Garden Dr
- 0 Sunny Ridge Dr
- 0 Sunny Ridge Dr Unit 56961044
- 16014 Royal Garden Dr
- 16007 Hickory Cove Dr