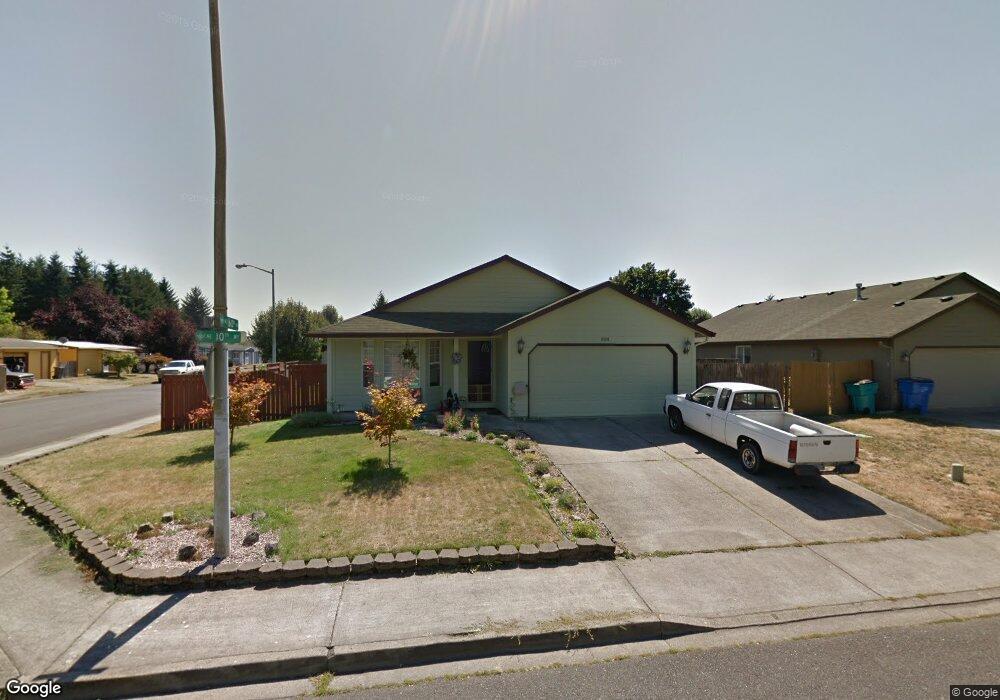
15911 NE 10th Way Vancouver, WA 98684
Countryside Woods NeighborhoodEstimated Value: $440,000 - $473,308
3
Beds
3
Baths
1,446
Sq Ft
$317/Sq Ft
Est. Value
About This Home
This home is located at 15911 NE 10th Way, Vancouver, WA 98684 and is currently estimated at $458,577, approximately $317 per square foot. 15911 NE 10th Way is a home located in Clark County with nearby schools including Mill Plain Elementary School, Pacific Middle School, and Evergreen High School.
Ownership History
Date
Name
Owned For
Owner Type
Purchase Details
Closed on
Dec 27, 2005
Sold by
Corse Brady W and Corse Joy D
Bought by
Derheim Lawrence A and Derheim Barbara J
Current Estimated Value
Home Financials for this Owner
Home Financials are based on the most recent Mortgage that was taken out on this home.
Original Mortgage
$112,500
Outstanding Balance
$3,275
Interest Rate
6.36%
Mortgage Type
Purchase Money Mortgage
Estimated Equity
$455,302
Purchase Details
Closed on
Jul 15, 2003
Sold by
Hud
Bought by
Corse Brady W and Corse Joy D
Purchase Details
Closed on
May 9, 2003
Sold by
Chase Manhattan Mortgage Corp
Bought by
Hud
Purchase Details
Closed on
Feb 12, 2003
Sold by
Vannguyen Nghia
Bought by
Chase Manhattan Mortgage Corp
Purchase Details
Closed on
Jun 19, 1998
Sold by
Karlsen Timothy K and Karlsen Carol A
Bought by
Vannguyen Nghia
Home Financials for this Owner
Home Financials are based on the most recent Mortgage that was taken out on this home.
Original Mortgage
$127,848
Interest Rate
7.17%
Mortgage Type
FHA
Create a Home Valuation Report for This Property
The Home Valuation Report is an in-depth analysis detailing your home's value as well as a comparison with similar homes in the area
Home Values in the Area
Average Home Value in this Area
Purchase History
| Date | Buyer | Sale Price | Title Company |
|---|---|---|---|
| Derheim Lawrence A | $237,500 | Cascade Title | |
| Corse Brady W | -- | First American Title | |
| Hud | -- | First American Title | |
| Chase Manhattan Mortgage Corp | $142,718 | First American Title | |
| Vannguyen Nghia | $130,037 | Chicago Title Insurance Co |
Source: Public Records
Mortgage History
| Date | Status | Borrower | Loan Amount |
|---|---|---|---|
| Open | Derheim Lawrence A | $112,500 | |
| Previous Owner | Vannguyen Nghia | $127,848 |
Source: Public Records
Tax History Compared to Growth
Tax History
| Year | Tax Paid | Tax Assessment Tax Assessment Total Assessment is a certain percentage of the fair market value that is determined by local assessors to be the total taxable value of land and additions on the property. | Land | Improvement |
|---|---|---|---|---|
| 2025 | $4,181 | $424,066 | $184,950 | $239,116 |
| 2024 | $3,996 | $421,371 | $184,950 | $236,421 |
| 2023 | $4,072 | $417,739 | $182,250 | $235,489 |
| 2022 | $3,626 | $420,609 | $182,250 | $238,359 |
| 2021 | $3,392 | $355,249 | $152,550 | $202,699 |
| 2020 | $3,208 | $314,065 | $135,000 | $179,065 |
| 2019 | $2,858 | $299,930 | $125,450 | $174,480 |
| 2018 | $3,016 | $287,743 | $0 | $0 |
| 2017 | $2,760 | $244,066 | $0 | $0 |
| 2016 | $2,528 | $231,199 | $0 | $0 |
| 2015 | $2,414 | $202,773 | $0 | $0 |
| 2014 | -- | $185,124 | $0 | $0 |
| 2013 | -- | $162,489 | $0 | $0 |
Source: Public Records
Map
Nearby Homes
- 1506 180th Ave
- 16209 NE 11th St
- 1413 NE 157th Ave
- 604 NE 156th Ave
- 16506 NE 13th St
- 16500 SE 1st St Unit 68
- 16500 SE 1st St Unit 170
- 16500 SE 1st St Unit 14
- 16500 SE 1st St Unit 56
- 16500 SE 1st St Unit 20
- 16500 SE 1st St Unit 144
- 16500 SE 1st St Unit 44
- 16500 SE 1st St Unit 149
- 713 NE 152nd Ave
- 714 NE 152nd Ave
- 1907 NE 158th Ave
- 405 NE 152nd Ave
- 16715 NE 5th St
- 419 NE 169th Ave
- 15813 SE 1st St
- 15907 NE 10th Way
- 15908 NE 10th St
- 15904 NE 10th St
- 15900 NE 10th St
- 16005 NE 10th Way
- 15901 NE 10th Way
- 15910 NE 10th Way
- 15816 NE 10th St
- 15916 NE 10th Way
- 15906 NE 10th Way
- 16002 NE 10th Way
- 15812 NE 10th St
- 16009 NE 10th Way
- 15817 NE 10th Way
- 15900 NE 10th Way
- 16006 NE 10th Way
- 15810 NE 10th St
- 15909 NE 10th St
- 15905 NE 10th St
- 16013 NE 10th Way