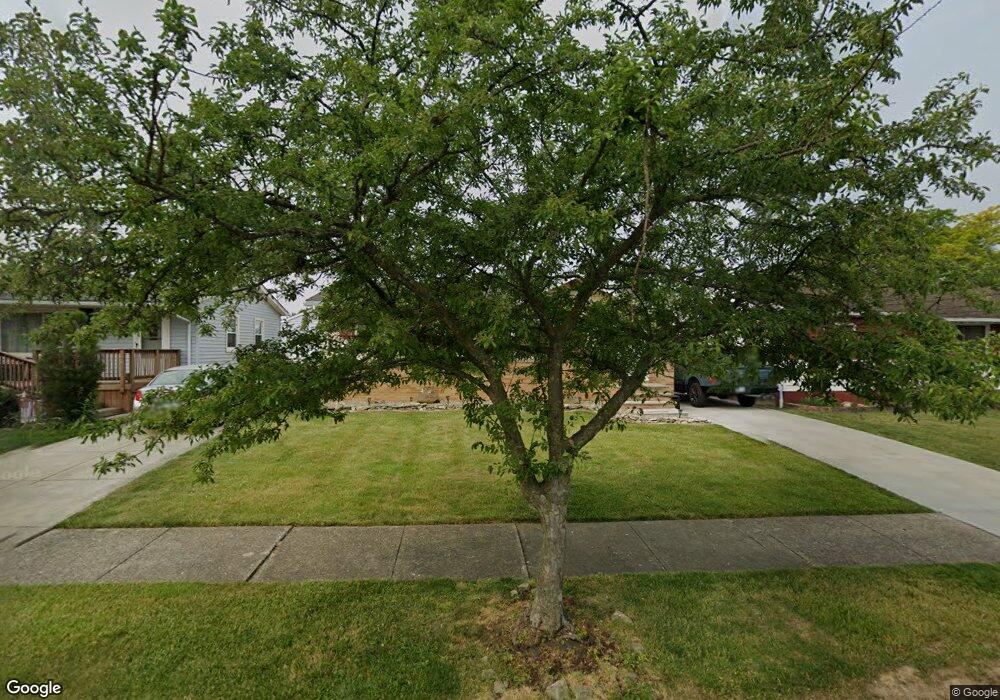
15911 Paulding Blvd Brookpark, OH 44142
Estimated Value: $194,697 - $237,000
3
Beds
2
Baths
912
Sq Ft
$240/Sq Ft
Est. Value
About This Home
This home is located at 15911 Paulding Blvd, Brookpark, OH 44142 and is currently estimated at $219,174, approximately $240 per square foot. 15911 Paulding Blvd is a home located in Cuyahoga County with nearby schools including Berea-Midpark Middle School, Berea-Midpark High School, and Huber Heights Preparatory Academy Parma Academy.
Ownership History
Date
Name
Owned For
Owner Type
Purchase Details
Closed on
Dec 3, 2021
Sold by
Henderson Deborah
Bought by
Todorovich George S
Current Estimated Value
Home Financials for this Owner
Home Financials are based on the most recent Mortgage that was taken out on this home.
Original Mortgage
$166,920
Outstanding Balance
$153,584
Interest Rate
3.14%
Mortgage Type
FHA
Estimated Equity
$65,590
Purchase Details
Closed on
Feb 21, 2018
Sold by
Henderson Deborah
Bought by
Henderson Daniel C and Burke Colleen
Purchase Details
Closed on
May 9, 2017
Sold by
Henderson Deborah and Henderson Douglas A
Bought by
Henderson Deborah
Purchase Details
Closed on
Mar 31, 1994
Sold by
Whyel James W
Bought by
Henderson Douglas A
Purchase Details
Closed on
Sep 19, 1991
Sold by
Rauscher Ross C and Rauscher Donna M
Bought by
Whyel James W
Purchase Details
Closed on
Jan 1, 1975
Bought by
Rauscher Ross C and Rauscher Donna M
Create a Home Valuation Report for This Property
The Home Valuation Report is an in-depth analysis detailing your home's value as well as a comparison with similar homes in the area
Home Values in the Area
Average Home Value in this Area
Purchase History
| Date | Buyer | Sale Price | Title Company |
|---|---|---|---|
| Todorovich George S | $170,000 | Gm Title | |
| Henderson Daniel C | -- | None Available | |
| Henderson Deborah | -- | None Available | |
| Henderson Douglas A | $87,000 | -- | |
| Whyel James W | $79,000 | -- | |
| Rauscher Ross C | -- | -- |
Source: Public Records
Mortgage History
| Date | Status | Borrower | Loan Amount |
|---|---|---|---|
| Open | Todorovich George S | $166,920 |
Source: Public Records
Tax History
| Year | Tax Paid | Tax Assessment Tax Assessment Total Assessment is a certain percentage of the fair market value that is determined by local assessors to be the total taxable value of land and additions on the property. | Land | Improvement |
|---|---|---|---|---|
| 2024 | $2,823 | $55,965 | $12,880 | $43,085 |
| 2023 | $2,689 | $44,140 | $9,380 | $34,760 |
| 2022 | $2,670 | $44,140 | $9,380 | $34,760 |
| 2021 | $2,654 | $44,140 | $9,380 | $34,760 |
| 2020 | $2,394 | $35,040 | $7,460 | $27,580 |
| 2019 | $2,322 | $100,100 | $21,300 | $78,800 |
| 2018 | $2,193 | $35,040 | $7,460 | $27,580 |
| 2017 | $2,246 | $31,440 | $7,320 | $24,120 |
| 2016 | $2,228 | $31,440 | $7,320 | $24,120 |
| 2015 | $2,200 | $31,440 | $7,320 | $24,120 |
| 2014 | $2,200 | $33,080 | $7,700 | $25,380 |
Source: Public Records
Map
Nearby Homes
- 16117 Hocking Blvd
- 15532 Rademaker Dr
- 15424 Holland Rd
- 16159 Bowfin Blvd
- 6330 Ledgebrook Dr
- 6330 Sandfield Dr
- 6377 Ledgebrook Dr
- 6386 Sandfield Dr
- 14801 Larkfield Dr
- 16379 Hummel Rd
- 6095 Stark Dr
- 6016 Gilmere Dr
- 5727 Gateway Ln Unit 1203
- 6103 Westbrook Dr
- 6014 Westbrook Dr
- 14396 Park Dr
- 14024 Donald Dr
- 6213 Siegler Dr
- 5889 Westbrook Dr
- 5757 Defiance Ave
- 15931 Paulding Blvd
- 15889 Paulding Blvd
- 15863 Paulding Blvd
- 15951 Paulding Blvd
- 15841 Paulding Blvd
- 15971 Paulding Blvd
- 15960 Cynthia Dr
- 15930 Cynthia Dr
- 16090 Cynthia Dr
- 15898 Paulding Blvd
- 15874 Paulding Blvd
- 15920 Paulding Blvd
- 15819 Paulding Blvd
- 15995 Paulding Blvd
- 15900 Cynthia Dr
- 16100 Cynthia Dr
- 15942 Paulding Blvd
- 15848 Paulding Blvd
- 15828 Paulding Blvd
- 15960 Paulding Blvd
Your Personal Tour Guide
Ask me questions while you tour the home.