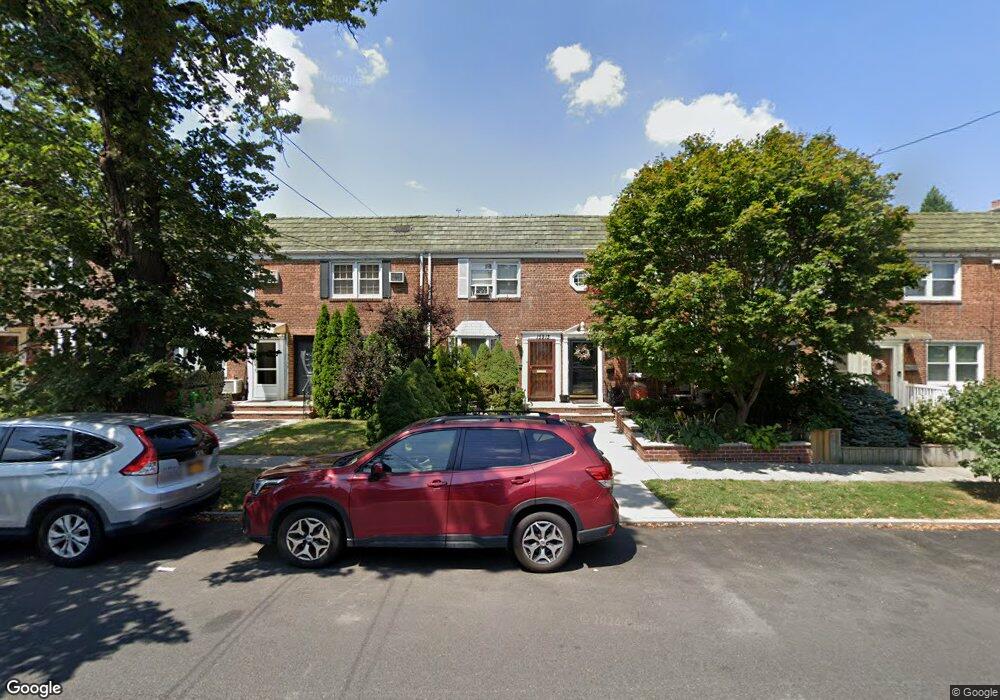
15911 Powells Cove Blvd Whitestone, NY 11357
Whitestone NeighborhoodEstimated Value: $814,866 - $906,000
--
Bed
--
Bath
1,024
Sq Ft
$850/Sq Ft
Est. Value
About This Home
This home is located at 15911 Powells Cove Blvd, Whitestone, NY 11357 and is currently estimated at $870,217, approximately $849 per square foot. 15911 Powells Cove Blvd is a home located in Queens County with nearby schools including J.H.S. 194 William Carr, Bayside High School, and Holy Cross School Greek Orthodox Day School.
Ownership History
Date
Name
Owned For
Owner Type
Purchase Details
Closed on
Feb 26, 2015
Sold by
Costa Lillian J
Bought by
Alexander Christopher
Current Estimated Value
Home Financials for this Owner
Home Financials are based on the most recent Mortgage that was taken out on this home.
Original Mortgage
$417,000
Interest Rate
3.65%
Mortgage Type
New Conventional
Purchase Details
Closed on
Feb 21, 2008
Sold by
Hamilton Clarisse
Bought by
Costa Lillian J
Home Financials for this Owner
Home Financials are based on the most recent Mortgage that was taken out on this home.
Original Mortgage
$400,000
Interest Rate
5.57%
Mortgage Type
Purchase Money Mortgage
Purchase Details
Closed on
Feb 11, 2005
Sold by
Jamison Janet and Oxberry Ann
Bought by
Tracz Brian M
Home Financials for this Owner
Home Financials are based on the most recent Mortgage that was taken out on this home.
Original Mortgage
$291,900
Interest Rate
5.73%
Mortgage Type
Purchase Money Mortgage
Create a Home Valuation Report for This Property
The Home Valuation Report is an in-depth analysis detailing your home's value as well as a comparison with similar homes in the area
Home Values in the Area
Average Home Value in this Area
Purchase History
| Date | Buyer | Sale Price | Title Company |
|---|---|---|---|
| Alexander Christopher | $565,000 | -- | |
| Alexander Christopher | $565,000 | -- | |
| Costa Lillian J | $500,000 | -- | |
| Costa Lillian J | $500,000 | -- | |
| Tracz Brian M | $364,905 | -- | |
| Tracz Brian M | $364,905 | -- |
Source: Public Records
Mortgage History
| Date | Status | Borrower | Loan Amount |
|---|---|---|---|
| Previous Owner | Alexander Christopher | $417,000 | |
| Previous Owner | Costa Lillian J | $400,000 | |
| Previous Owner | Tracz Brian M | $291,900 |
Source: Public Records
Tax History Compared to Growth
Tax History
| Year | Tax Paid | Tax Assessment Tax Assessment Total Assessment is a certain percentage of the fair market value that is determined by local assessors to be the total taxable value of land and additions on the property. | Land | Improvement |
|---|---|---|---|---|
| 2025 | $6,681 | $36,743 | $8,549 | $28,194 |
| 2024 | $6,693 | $34,664 | $8,045 | $26,619 |
| 2023 | $6,287 | $32,704 | $7,268 | $25,436 |
| 2022 | $5,872 | $42,600 | $10,680 | $31,920 |
| 2021 | $6,197 | $41,340 | $10,680 | $30,660 |
| 2020 | $6,185 | $42,900 | $10,680 | $32,220 |
| 2019 | $5,750 | $43,920 | $10,680 | $33,240 |
| 2018 | $5,258 | $27,253 | $7,197 | $20,056 |
| 2017 | $4,942 | $25,712 | $7,810 | $17,902 |
| 2016 | $4,830 | $25,712 | $7,810 | $17,902 |
| 2015 | $2,926 | $25,516 | $11,153 | $14,363 |
| 2014 | $2,926 | $24,073 | $9,787 | $14,286 |
Source: Public Records
Map
Nearby Homes
- 6-23 159th St
- 7-16 160th St
- 160-15 Powells Cove Blvd Unit A103
- 160-15 Powells Cove Blvd Unit A304
- 160-15 Powells Cove Blvd Unit D -302
- 160-15 Powells Cove Blvd Unit C107
- 160-15 Powells Cove Blvd Unit D203
- 160-15 Powells Cove Blvd Unit A1
- 160-15 Powells Cove Blvd Unit C202
- 154-81 Riverside Dr
- 160 Riverside Dr Unit 5C
- 154-60 Riverside Dr
- 16201 Powells Cove Blvd Unit 6K
- 162-01 Powells Cove Blvd Unit 1
- 15445 Riverside Dr
- 162-11 9th Ave Unit 3D
- 162-21 Powells Cove Blvd Unit 1M
- 162-21 Powells Cove Blvd Unit 3D
- 162-20 9th Ave Unit 2A
- 1001 157th St
- 159-11 Powells Cove Blvd
- 15913 Powells Cove Blvd
- 159-09 Powells Cove Blvd
- 15909 Powells Cove Blvd
- 13-16 Powells Cove Blvd
- 15915 Powells Cove Blvd
- 15907 Powells Cove Blvd
- 159-17 Powells Cove Blvd
- 15917 Powells Cove Blvd
- 15905 Powells Cove Blvd
- 159-05 Powells Cove Blvd
- 15919 Powells Cove Blvd
- 15903 Powells Cove Blvd
- 159-03 Powells Cove Blvd
- 633 159th St
- 15921 Powells Cove Blvd
- 632 160th St
- 15901 Powells Cove Blvd
- 631 159th St
- 159-23 Powells Cove Blvd