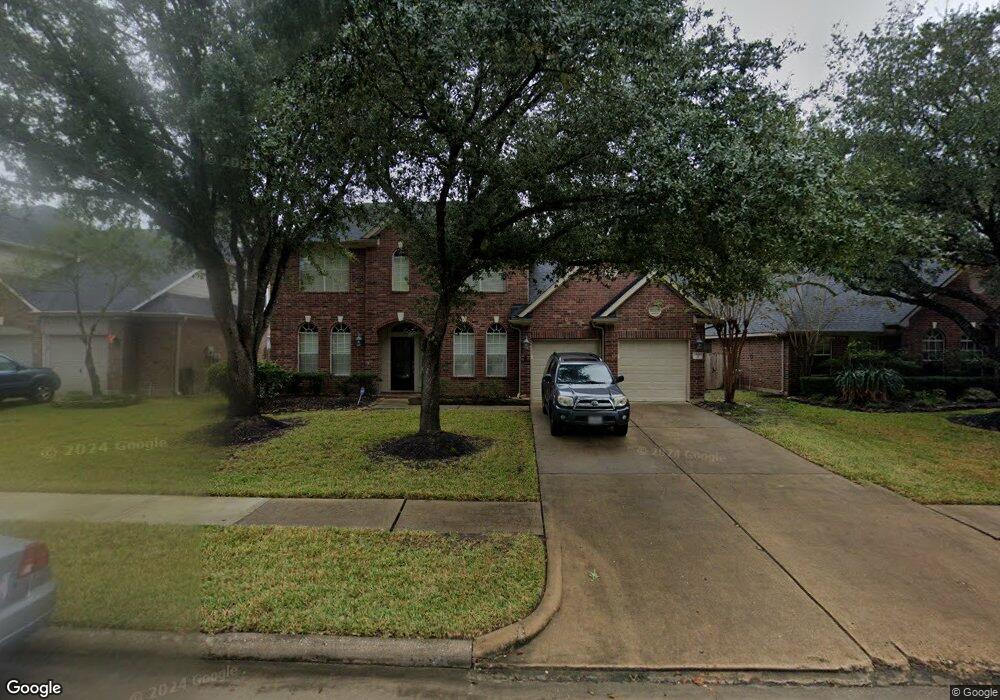
15915 Augustin Landing Dr Cypress, TX 77429
Estimated Value: $452,000 - $496,000
4
Beds
3
Baths
2,874
Sq Ft
$166/Sq Ft
Est. Value
About This Home
This home is located at 15915 Augustin Landing Dr, Cypress, TX 77429 and is currently estimated at $476,723, approximately $165 per square foot. 15915 Augustin Landing Dr is a home located in Harris County with nearby schools including Sampson Elementary School, Spillane Middle School, and Cypress Woods High School.
Ownership History
Date
Name
Owned For
Owner Type
Purchase Details
Closed on
May 6, 2013
Sold by
Tipton John K and Tipton Kimberly K
Bought by
Shnayder Valeriy
Current Estimated Value
Home Financials for this Owner
Home Financials are based on the most recent Mortgage that was taken out on this home.
Original Mortgage
$140,000
Outstanding Balance
$99,782
Interest Rate
3.61%
Mortgage Type
New Conventional
Estimated Equity
$376,941
Purchase Details
Closed on
Apr 24, 2003
Sold by
Johnson Judd W and Johnson Trina
Bought by
Tipton John K and Tipton Kimberly K
Home Financials for this Owner
Home Financials are based on the most recent Mortgage that was taken out on this home.
Original Mortgage
$150,000
Interest Rate
5.8%
Purchase Details
Closed on
Dec 26, 2001
Sold by
Mhi Partnership Ltd
Bought by
Johnson Judd W and Johnson Trina
Home Financials for this Owner
Home Financials are based on the most recent Mortgage that was taken out on this home.
Original Mortgage
$225,500
Interest Rate
6.73%
Create a Home Valuation Report for This Property
The Home Valuation Report is an in-depth analysis detailing your home's value as well as a comparison with similar homes in the area
Home Values in the Area
Average Home Value in this Area
Purchase History
| Date | Buyer | Sale Price | Title Company |
|---|---|---|---|
| Shnayder Valeriy | -- | Stewart Title | |
| Tipton John K | -- | Stewart Title | |
| Johnson Judd W | -- | Millennium Title |
Source: Public Records
Mortgage History
| Date | Status | Borrower | Loan Amount |
|---|---|---|---|
| Open | Shnayder Valeriy | $140,000 | |
| Previous Owner | Tipton John K | $150,000 | |
| Previous Owner | Johnson Judd W | $225,500 |
Source: Public Records
Tax History Compared to Growth
Tax History
| Year | Tax Paid | Tax Assessment Tax Assessment Total Assessment is a certain percentage of the fair market value that is determined by local assessors to be the total taxable value of land and additions on the property. | Land | Improvement |
|---|---|---|---|---|
| 2025 | $6,873 | $463,542 | $103,198 | $360,344 |
| 2024 | $6,873 | $466,511 | $93,857 | $372,654 |
| 2023 | $6,873 | $466,511 | $93,857 | $372,654 |
| 2022 | $8,572 | $417,414 | $67,168 | $350,246 |
| 2021 | $8,276 | $333,405 | $67,168 | $266,237 |
| 2020 | $7,757 | $297,281 | $48,737 | $248,544 |
| 2019 | $7,907 | $293,853 | $48,737 | $245,116 |
| 2018 | $3,179 | $307,228 | $48,737 | $258,491 |
| 2017 | $8,268 | $307,228 | $48,737 | $258,491 |
| 2016 | $8,268 | $307,228 | $48,737 | $258,491 |
| 2015 | $6,126 | $307,228 | $48,737 | $258,491 |
| 2014 | $6,126 | $274,664 | $48,737 | $225,927 |
Source: Public Records
Map
Nearby Homes
- 13718 Sherburn Manor Dr
- 16219 Haden Crest Ct
- 13611 Monteigne Ln
- 16306 Bontura St
- 15923 Hurstfield Pointe Dr
- 13014 Vivienne Westmoreland Dr
- 16322 Bontura St
- 16211 Halpren Falls Ln
- 14103 Sherburn Manor Dr
- 13703 Layton Hills Dr
- 15803 Stiller Park Dr
- 14210 Prospect Point Dr
- 16406 Haden Crest Ct
- 13402 Layton Castle Ln
- 14126 Bloomingdale Manor Dr
- 13002 Huffmeister Rd
- 14314 Prosper Ridge Dr
- 15922 Clipper Pointe Dr
- 13926 Wessex Park Dr
- 16515 Dunleith Cir
- 15911 Augustin Landing Dr
- 15919 Augustin Landing Dr
- 15907 Augustin Landing Dr
- 15923 Augustin Landing Dr
- 15914 Augustin Landing Dr
- 15903 Augustin Landing Dr
- 15918 Augustin Landing Dr
- 15927 Augustin Landing Dr
- 15910 Augustin Landing Dr
- 15922 Augustin Landing Dr
- 15906 Augustin Landing Dr
- 15823 Augustin Landing Dr
- 15902 Augustin Landing Dr
- 13703 Sherburn Manor Dr
- 15914 Ashton Hills Dr
- 15910 Ashton Hills Dr
- 13714 Sherburn Manor Dr
- 13707 Sherburn Manor Dr
- 15918 Ashton Hills Dr
- 15906 Ashton Hills Dr