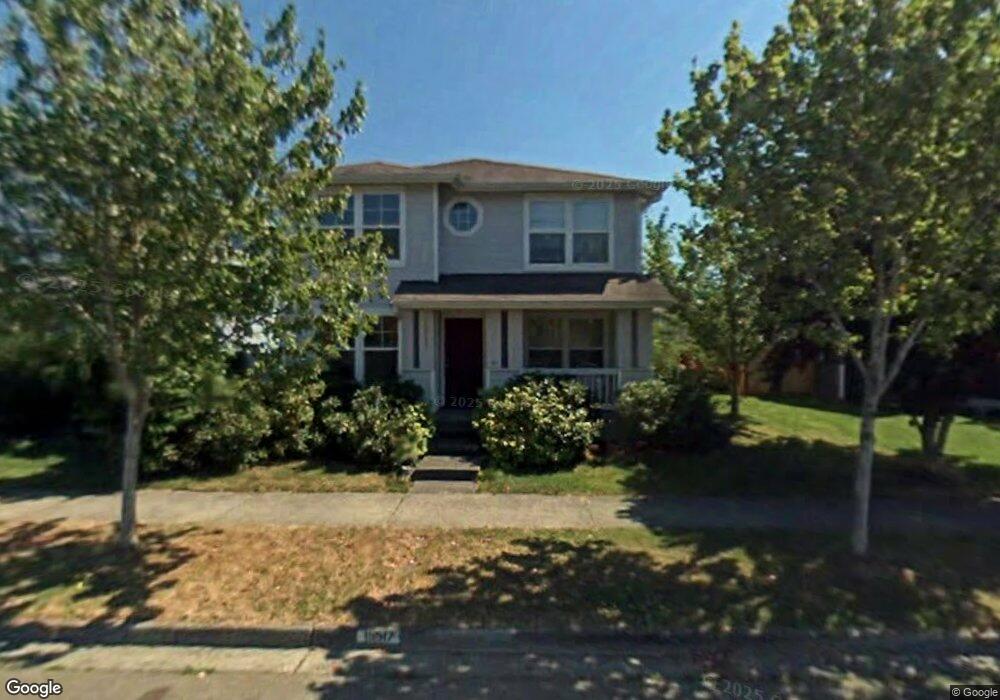
15917 Lords Lake Ave SE Monroe, WA 98272
Estimated Value: $645,461 - $707,000
3
Beds
3
Baths
1,814
Sq Ft
$372/Sq Ft
Est. Value
About This Home
This home is located at 15917 Lords Lake Ave SE, Monroe, WA 98272 and is currently estimated at $675,365, approximately $372 per square foot. 15917 Lords Lake Ave SE is a home located in Snohomish County with nearby schools including Fryelands Elementary School, Monroe High School, and Monroe Christian School.
Ownership History
Date
Name
Owned For
Owner Type
Purchase Details
Closed on
Jun 29, 2018
Sold by
Bunnell Terryn
Bought by
Bunnell Terryn and Gonzales Trena
Current Estimated Value
Purchase Details
Closed on
Apr 12, 2013
Sold by
Bunnell Terryn S and Bunnell Christine J
Bought by
Bunnell Terryn S
Purchase Details
Closed on
Mar 15, 2002
Sold by
Uhrberg Anders S and Uhrberg Hilda P
Bought by
Bunnell Terryn S and Bunnell Christine J
Home Financials for this Owner
Home Financials are based on the most recent Mortgage that was taken out on this home.
Original Mortgage
$199,678
Outstanding Balance
$82,177
Interest Rate
6.85%
Mortgage Type
FHA
Estimated Equity
$593,188
Purchase Details
Closed on
Mar 24, 1999
Sold by
Dean Deily Company Llc
Bought by
Uhrberg Anders S and Uhrberg Hilda P
Home Financials for this Owner
Home Financials are based on the most recent Mortgage that was taken out on this home.
Original Mortgage
$175,900
Interest Rate
6.73%
Create a Home Valuation Report for This Property
The Home Valuation Report is an in-depth analysis detailing your home's value as well as a comparison with similar homes in the area
Home Values in the Area
Average Home Value in this Area
Purchase History
| Date | Buyer | Sale Price | Title Company |
|---|---|---|---|
| Bunnell Terryn | -- | None Available | |
| Bunnell Terryn S | -- | None Available | |
| Bunnell Terryn S | $202,500 | -- | |
| Uhrberg Anders S | $185,200 | Chicago Title Insurance Co |
Source: Public Records
Mortgage History
| Date | Status | Borrower | Loan Amount |
|---|---|---|---|
| Open | Bunnell Terryn S | $199,678 | |
| Previous Owner | Uhrberg Anders S | $175,900 |
Source: Public Records
Tax History Compared to Growth
Tax History
| Year | Tax Paid | Tax Assessment Tax Assessment Total Assessment is a certain percentage of the fair market value that is determined by local assessors to be the total taxable value of land and additions on the property. | Land | Improvement |
|---|---|---|---|---|
| 2025 | $4,460 | $578,300 | $303,500 | $274,800 |
| 2024 | $4,460 | $550,800 | $288,500 | $262,300 |
| 2023 | $4,399 | $589,400 | $318,000 | $271,400 |
| 2022 | $4,047 | $432,600 | $214,000 | $218,600 |
| 2020 | $3,659 | $376,900 | $187,000 | $189,900 |
| 2019 | $3,523 | $358,300 | $177,000 | $181,300 |
| 2018 | $3,799 | $316,600 | $147,000 | $169,600 |
| 2017 | $3,225 | $281,200 | $123,000 | $158,200 |
| 2016 | $3,173 | $254,600 | $103,000 | $151,600 |
| 2015 | $3,069 | $231,700 | $89,000 | $142,700 |
| 2013 | $2,632 | $181,700 | $73,000 | $108,700 |
Source: Public Records
Map
Nearby Homes
- 15648 Lakeview Ave SE
- 16096 Roma Dr SE
- 16951 Tulip Ln
- 16449 169th St SE Unit 16449
- 17284 157th St SE
- 16673 167th Ave SE Unit 16673
- 15111 167th Ave SE
- 17342 Mountain View Rd SE
- 16625 Ladd St SE
- 23311 165th Ave SE
- 16855 Wales St SE
- 15217 172nd Ave SE
- 17417 W Main St Unit E101
- 17510 W Main St Unit C103
- 15087 172nd Ave SE
- 16311 177th Ave SE
- 17856 152nd St SE
- 15027 179th Ave SE
- 17795 149th St SE Unit 9
- 17815 149th St SE Unit 14
- 15917 Lord's Lake Ave SE
- 15899 Lords Lake Ave SE
- 15953 Lords Lake Ave SE
- 15890 Lakeview Ave SE
- 15971 Lords Lake Ave SE
- 15881 Lords Lake Ave SE
- 15872 Lakeview Ave SE
- 15910 Lakeview Ave SE
- 15985 Lords Lake Ave SE
- 15863 Lords Lake Ave SE
- 15946 Lakeview Ave SE
- 15836 Lakeview Ave SE
- 15843 Lords Lake Ave SE
- 15818 Lakeview Ave SE
- 15997 Lords Lake Ave SE
- 15825 Lords Lake Ave SE
- 15891 Lakeview Ave SE
- 15909 Lakeview Ave SE
- 15873 Lakeview Ave SE
- 15798 Lakeview Ave SE