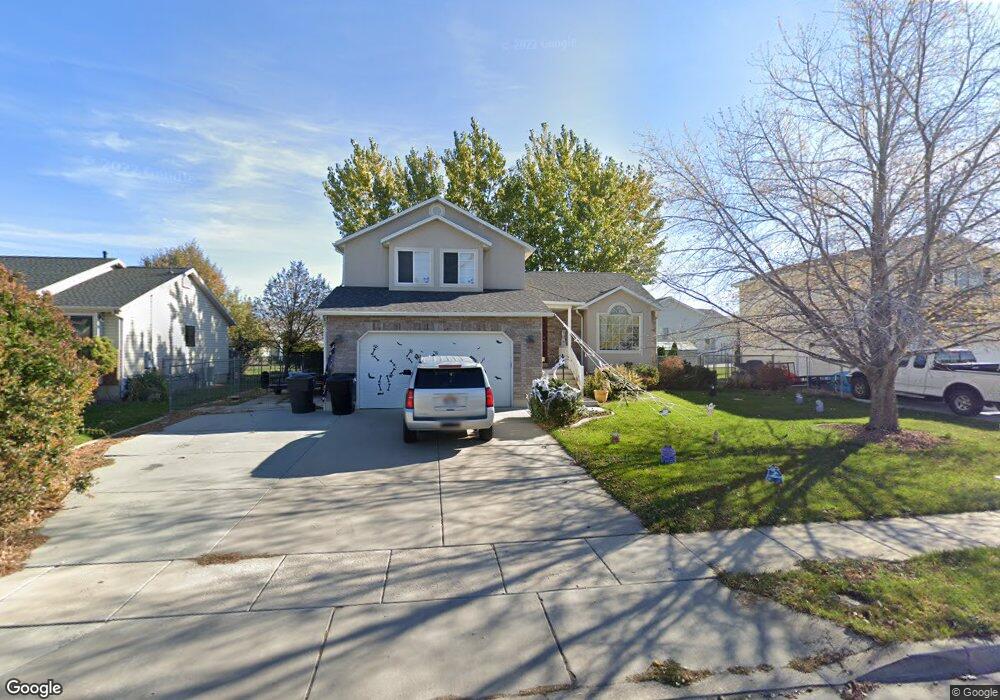
1592 N 2615 W Clearfield, UT 84015
Estimated Value: $506,000 - $536,000
5
Beds
4
Baths
2,400
Sq Ft
$217/Sq Ft
Est. Value
About This Home
This home is located at 1592 N 2615 W, Clearfield, UT 84015 and is currently estimated at $519,810, approximately $216 per square foot. 1592 N 2615 W is a home located in Davis County with nearby schools including West Clinton Elementary School, West Point Junior High School, and Syracuse High School.
Ownership History
Date
Name
Owned For
Owner Type
Purchase Details
Closed on
Apr 20, 2020
Sold by
Graham Jennifer A and Graham Mark R
Bought by
Candland Robert and Candland Holli
Current Estimated Value
Home Financials for this Owner
Home Financials are based on the most recent Mortgage that was taken out on this home.
Original Mortgage
$343,660
Outstanding Balance
$304,268
Interest Rate
3.37%
Mortgage Type
FHA
Estimated Equity
$215,542
Purchase Details
Closed on
Apr 8, 2013
Sold by
Graham Mark and Graham Jennifer A
Bought by
Graham Jennifer A and Graham Mark R
Home Financials for this Owner
Home Financials are based on the most recent Mortgage that was taken out on this home.
Original Mortgage
$124,085
Interest Rate
2.72%
Mortgage Type
New Conventional
Purchase Details
Closed on
Mar 26, 2003
Sold by
Riddle Brandon B and Riddle Pamela M
Bought by
Graham Mark and Graham Jennifer A
Home Financials for this Owner
Home Financials are based on the most recent Mortgage that was taken out on this home.
Original Mortgage
$124,000
Interest Rate
5.79%
Purchase Details
Closed on
Jun 29, 2001
Sold by
Nelson Jacob S and Nelson Jodi
Bought by
Riddle Brandon B and Riddle Pamela M
Home Financials for this Owner
Home Financials are based on the most recent Mortgage that was taken out on this home.
Original Mortgage
$151,410
Interest Rate
7.24%
Mortgage Type
VA
Purchase Details
Closed on
Apr 16, 1999
Sold by
Nelson Jacob S and Nelson Jodi
Bought by
Nelson Jacob S and Nelson Jodi
Home Financials for this Owner
Home Financials are based on the most recent Mortgage that was taken out on this home.
Original Mortgage
$125,203
Interest Rate
7.1%
Mortgage Type
FHA
Purchase Details
Closed on
Jan 13, 1999
Sold by
Mark Higley Construction Lc
Bought by
Nelson Dennis C and Nelson Jacob S
Create a Home Valuation Report for This Property
The Home Valuation Report is an in-depth analysis detailing your home's value as well as a comparison with similar homes in the area
Home Values in the Area
Average Home Value in this Area
Purchase History
| Date | Buyer | Sale Price | Title Company |
|---|---|---|---|
| Candland Robert | -- | Stewart Title Ins A | |
| Graham Jennifer A | -- | Inwest Title Services | |
| Graham Mark | -- | First American Title Co | |
| Riddle Brandon B | -- | Associated Title Company | |
| Nelson Jacob S | -- | First American Title Co | |
| Nelson Jacob S | -- | First American Title Co | |
| Nelson Dennis C | -- | First American Title Co |
Source: Public Records
Mortgage History
| Date | Status | Borrower | Loan Amount |
|---|---|---|---|
| Open | Candland Robert | $343,660 | |
| Previous Owner | Graham Jennifer A | $124,085 | |
| Previous Owner | Graham Mark | $124,000 | |
| Previous Owner | Riddle Brandon B | $151,410 | |
| Previous Owner | Nelson Jacob S | $125,203 | |
| Closed | Graham Mark | $15,500 |
Source: Public Records
Tax History Compared to Growth
Tax History
| Year | Tax Paid | Tax Assessment Tax Assessment Total Assessment is a certain percentage of the fair market value that is determined by local assessors to be the total taxable value of land and additions on the property. | Land | Improvement |
|---|---|---|---|---|
| 2025 | $2,717 | $261,250 | $86,993 | $174,257 |
| 2024 | $2,612 | $252,450 | $95,964 | $156,486 |
| 2023 | $2,505 | $448,000 | $108,586 | $339,414 |
| 2022 | $2,691 | $266,200 | $67,156 | $199,044 |
| 2021 | $2,453 | $360,000 | $82,833 | $277,167 |
| 2020 | $2,052 | $298,000 | $69,736 | $228,264 |
| 2019 | $2,001 | $284,000 | $82,697 | $201,303 |
| 2018 | $1,865 | $260,000 | $70,008 | $189,992 |
| 2016 | $1,633 | $117,535 | $27,124 | $90,411 |
| 2015 | $1,587 | $108,625 | $27,124 | $81,501 |
| 2014 | $1,532 | $106,546 | $27,124 | $79,422 |
| 2013 | -- | $96,851 | $25,731 | $71,120 |
Source: Public Records
Map
Nearby Homes
- 1648 N 2615 W
- 1509 N 2475 W
- 2647 W 1445 N
- 1449 N 2475 W
- 1458 N 2400 W
- 1251 N 2525 W
- 2259 W 1800 N
- 2371 W 1300 N
- 1694 N 2225 W
- 3941 W 1800 N
- 2921 W 1300 N
- 2959 W 1300 N
- 2617 N 2080 W Unit 176
- 2617 N 2080 W
- 2148 W 1570 N
- Harvard Plan at Summerfield - Enclave
- 2208 W 2615 N
- Linden Plan at Summerfield - Vista
- Yale Plan at Summerfield - Enclave
- Gambel Oak Plan at Summerfield - Vista