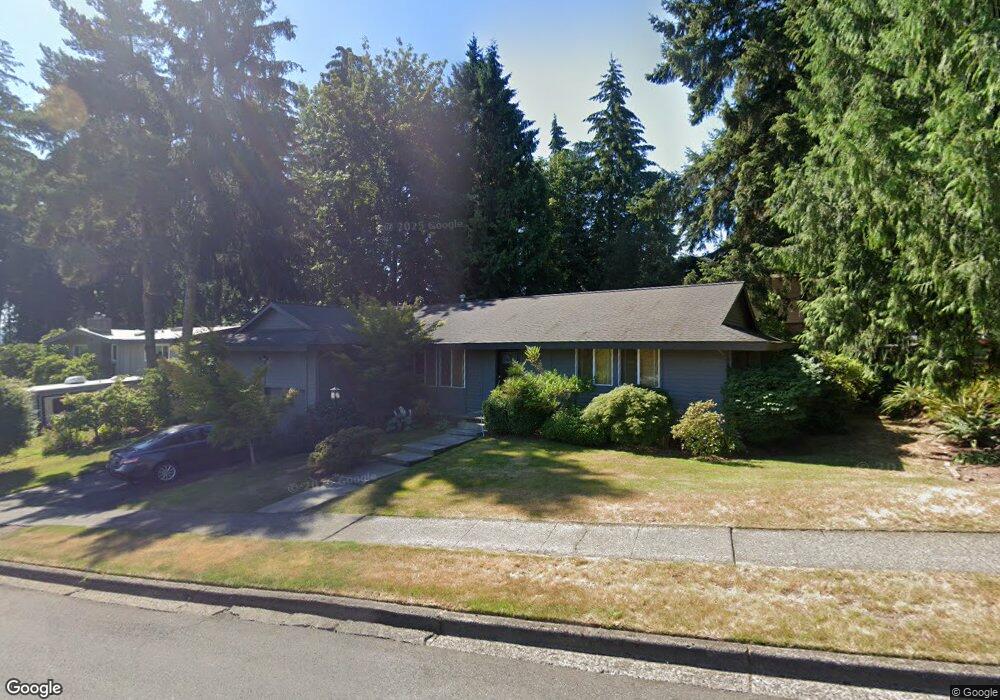
15921 NE 55th Way Redmond, WA 98052
Overlake NeighborhoodEstimated Value: $954,000 - $1,414,000
3
Beds
2
Baths
1,380
Sq Ft
$917/Sq Ft
Est. Value
About This Home
This home is located at 15921 NE 55th Way, Redmond, WA 98052 and is currently estimated at $1,264,889, approximately $916 per square foot. 15921 NE 55th Way is a home located in King County with nearby schools including Benjamin Rush Elementary School, Rose Hill Middle School, and Lake Washington High School.
Ownership History
Date
Name
Owned For
Owner Type
Purchase Details
Closed on
Jun 21, 2007
Sold by
Dexter M Craig and Dexter Marilyn K
Bought by
Dean James W
Current Estimated Value
Home Financials for this Owner
Home Financials are based on the most recent Mortgage that was taken out on this home.
Original Mortgage
$372,000
Outstanding Balance
$226,761
Interest Rate
6.12%
Mortgage Type
New Conventional
Estimated Equity
$1,038,128
Purchase Details
Closed on
Jun 29, 2004
Sold by
Wallin Marilyn K
Bought by
Wallin Marilyn K
Purchase Details
Closed on
Oct 31, 2001
Sold by
Magnuson Benjamin D and Magnuson Lillian
Bought by
Lapic Patrick A and Lapic Susan
Purchase Details
Closed on
Dec 24, 1997
Sold by
Greer Vernon E and Greer Shirley A
Bought by
Greer James M
Purchase Details
Closed on
Oct 27, 1993
Sold by
Schroeder Robert J and Schroeder Audrey A
Bought by
Schroeder & Sons
Purchase Details
Closed on
Oct 1, 1993
Sold by
Sayler Robert and Sayler Martha L
Bought by
Sayler Bentley S and Sayler Elizabeth J
Purchase Details
Closed on
Nov 29, 1989
Sold by
Rice Edwin A and Rice Cheri C
Bought by
Dexter Dexter M and Dexter Marilyn K
Create a Home Valuation Report for This Property
The Home Valuation Report is an in-depth analysis detailing your home's value as well as a comparison with similar homes in the area
Home Values in the Area
Average Home Value in this Area
Purchase History
| Date | Buyer | Sale Price | Title Company |
|---|---|---|---|
| Dean James W | $465,000 | Commonwealth L | |
| Wallin Marilyn K | -- | Chicago Title | |
| Lapic Patrick A | -- | -- | |
| Greer James M | -- | -- | |
| Schroeder & Sons | -- | Transamerica Title Ins Svcs | |
| Sayler Bentley S | -- | Stewart Title | |
| Dexter Dexter M | $139,900 | -- |
Source: Public Records
Mortgage History
| Date | Status | Borrower | Loan Amount |
|---|---|---|---|
| Open | Dean James W | $372,000 |
Source: Public Records
Tax History Compared to Growth
Tax History
| Year | Tax Paid | Tax Assessment Tax Assessment Total Assessment is a certain percentage of the fair market value that is determined by local assessors to be the total taxable value of land and additions on the property. | Land | Improvement |
|---|---|---|---|---|
| 2024 | $8,885 | $1,130,000 | $876,000 | $254,000 |
| 2023 | $7,708 | $931,000 | $735,000 | $196,000 |
| 2022 | $6,611 | $1,120,000 | $649,000 | $471,000 |
| 2021 | $6,269 | $768,000 | $448,000 | $320,000 |
| 2020 | $6,129 | $673,000 | $393,000 | $280,000 |
| 2018 | $5,608 | $640,000 | $385,000 | $255,000 |
| 2017 | $4,312 | $561,000 | $340,000 | $221,000 |
| 2016 | $4,217 | $450,000 | $264,000 | $186,000 |
| 2015 | $4,189 | $436,000 | $258,000 | $178,000 |
| 2014 | -- | $418,000 | $247,000 | $171,000 |
| 2013 | -- | $345,000 | $210,000 | $135,000 |
Source: Public Records
Map
Nearby Homes
- 15810 NE 49th St
- 5858 156th Ave NE
- 5733 155th Ave NE
- 15525 NE 60th St
- 16375 NE 44th Ct
- 6540 159th Ave NE
- 16409 NE 43rd Ct
- 6910 Old Redmond Rd Unit 135
- 15734 NE 70th Ct Unit 15734
- 15662 NE 70th Ct
- 14606 NE 51st St Unit C7
- 7292 W Lake Sammamish Pkwy NE Unit 4-306
- 17301 NE 45th St Unit 88
- 7250 Old Redmond Rd Unit H127
- 7250 Old Redmond Rd Unit C111
- 14820 NE 70th Ct
- 7435 Old Redmond Rd Unit 325
- 7316 151st Ave NE
- 7330 151st Ave NE
- 14651 NE 40th St Unit G1
- 5424 159th Place NE
- 15939 NE 55th Way
- 5506 159th Place NE
- 5418 159th Place NE
- 5427 159th Place NE
- 5507 160th Ave NE
- 5421 159th Place NE
- 15945 NE 55th Way
- 15940 NE 55th Way
- 5445 160th Ave NE
- 5512 159th Place NE
- 5415 159th Place NE
- 5509 159th Place NE
- 5412 159th Place NE
- 5515 160th Ave NE
- 5431 160th Ave NE
- 15951 NE 55th Way
- 5518 159th Place NE
- 5515 159th Place NE
- 5443 160th Ave NE