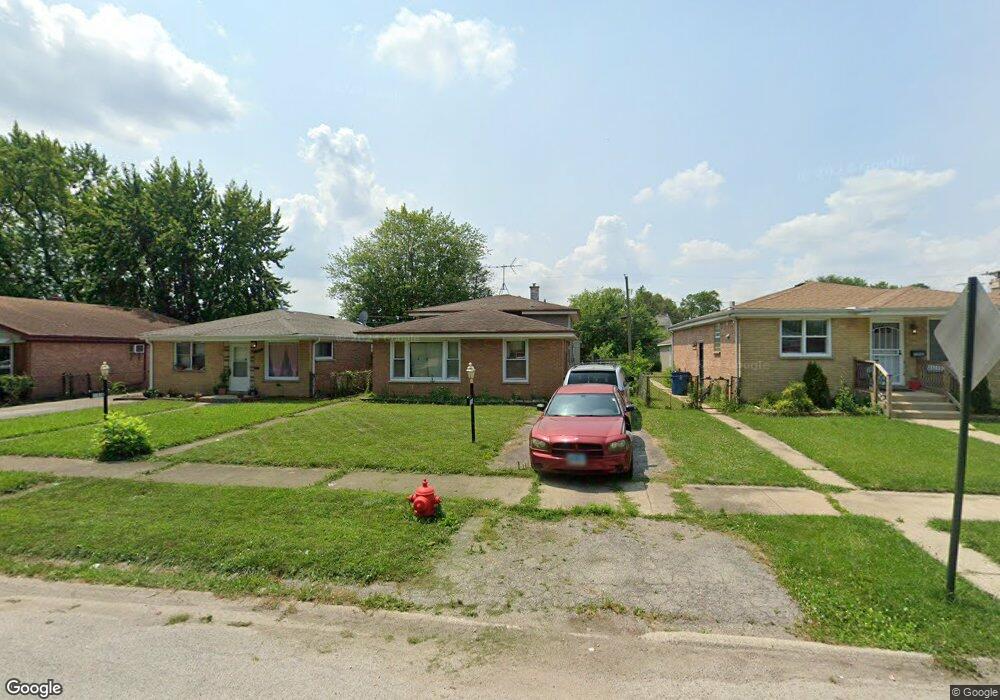
15926 Gauger Ave Harvey, IL 60426
Estimated Value: $108,000 - $176,000
--
Bed
2
Baths
1,150
Sq Ft
$128/Sq Ft
Est. Value
About This Home
This home is located at 15926 Gauger Ave, Harvey, IL 60426 and is currently estimated at $147,561, approximately $128 per square foot. 15926 Gauger Ave is a home located in Cook County with nearby schools including Brooks Middle School, Thornton Township High School, and Calvary Academy.
Ownership History
Date
Name
Owned For
Owner Type
Purchase Details
Closed on
Jul 9, 2003
Sold by
Hud
Bought by
Starkey Tiwana
Current Estimated Value
Home Financials for this Owner
Home Financials are based on the most recent Mortgage that was taken out on this home.
Original Mortgage
$67,900
Outstanding Balance
$28,955
Interest Rate
5.3%
Mortgage Type
Unknown
Estimated Equity
$118,606
Purchase Details
Closed on
Sep 23, 2002
Sold by
Bell Mattie D
Bought by
Hud
Purchase Details
Closed on
Nov 26, 1997
Sold by
Price Bernice
Bought by
Bell Mattie D
Home Financials for this Owner
Home Financials are based on the most recent Mortgage that was taken out on this home.
Original Mortgage
$65,400
Interest Rate
7.46%
Mortgage Type
FHA
Purchase Details
Closed on
Jul 7, 1997
Sold by
Lasalle National Bank
Bought by
Price Bernice
Create a Home Valuation Report for This Property
The Home Valuation Report is an in-depth analysis detailing your home's value as well as a comparison with similar homes in the area
Home Values in the Area
Average Home Value in this Area
Purchase History
| Date | Buyer | Sale Price | Title Company |
|---|---|---|---|
| Starkey Tiwana | -- | Stewart Title | |
| Hud | -- | -- | |
| Bell Mattie D | $65,500 | -- | |
| Price Bernice | -- | -- |
Source: Public Records
Mortgage History
| Date | Status | Borrower | Loan Amount |
|---|---|---|---|
| Open | Starkey Tiwana | $67,900 | |
| Previous Owner | Bell Mattie D | $65,400 |
Source: Public Records
Tax History Compared to Growth
Tax History
| Year | Tax Paid | Tax Assessment Tax Assessment Total Assessment is a certain percentage of the fair market value that is determined by local assessors to be the total taxable value of land and additions on the property. | Land | Improvement |
|---|---|---|---|---|
| 2024 | $2,604 | $7,300 | $1,597 | $5,703 |
| 2023 | $907 | $7,300 | $1,597 | $5,703 |
| 2022 | $907 | $4,535 | $1,351 | $3,184 |
| 2021 | $946 | $4,535 | $1,351 | $3,184 |
| 2020 | $1,156 | $4,535 | $1,351 | $3,184 |
| 2019 | $4,263 | $8,923 | $1,228 | $7,695 |
| 2018 | $4,155 | $8,923 | $1,228 | $7,695 |
| 2017 | $4,105 | $8,923 | $1,228 | $7,695 |
| 2016 | $4,521 | $9,481 | $1,105 | $8,376 |
| 2015 | $4,263 | $9,481 | $1,105 | $8,376 |
| 2014 | $4,286 | $9,481 | $1,105 | $8,376 |
| 2013 | $2,935 | $7,454 | $1,105 | $6,349 |
Source: Public Records
Map
Nearby Homes
- 69 E 159th St
- 16018 Loomis Ave
- 15944 Paulina St
- 16122 Ashland Ave
- 15734 Marshfield Ave
- 28 E 157th St
- 16118 Paulina St
- 15702 Marshfield Ave
- 16019 Wood St
- 15633 Myrtle Ave
- 15626 Myrtle Ave
- 15727 Turlington Ave
- 15612 Loomis Ave
- 15633 Lexington Ave
- 15603 Marshfield Ave
- 16306 Park Ave
- 16154 Wood St
- 16145 Honore Ave
- 16333 Justine St
- 16340 Justine St
- 15922 Gauger Ave
- 15928 Gauger Ave
- 15918 Gauger Ave
- 15932 Gauger Ave
- 15934 Gauger Ave
- 15934 Gauger Ave
- 15927 Vine Ave
- 15912 Gauger Ave
- 15938 Gauger Ave
- 15938 Gauger Ave
- 15938 Gauger Ave
- 15919 Vine Ave
- 15935 Vine Ave
- 15915 Vine Ave
- 15939 Vine Ave
- 15927 Gauger Ave
- 15923 Gauger Ave
- 15929 Gauger Ave
- 15919 Gauger Ave
- 15933 Gauger Ave