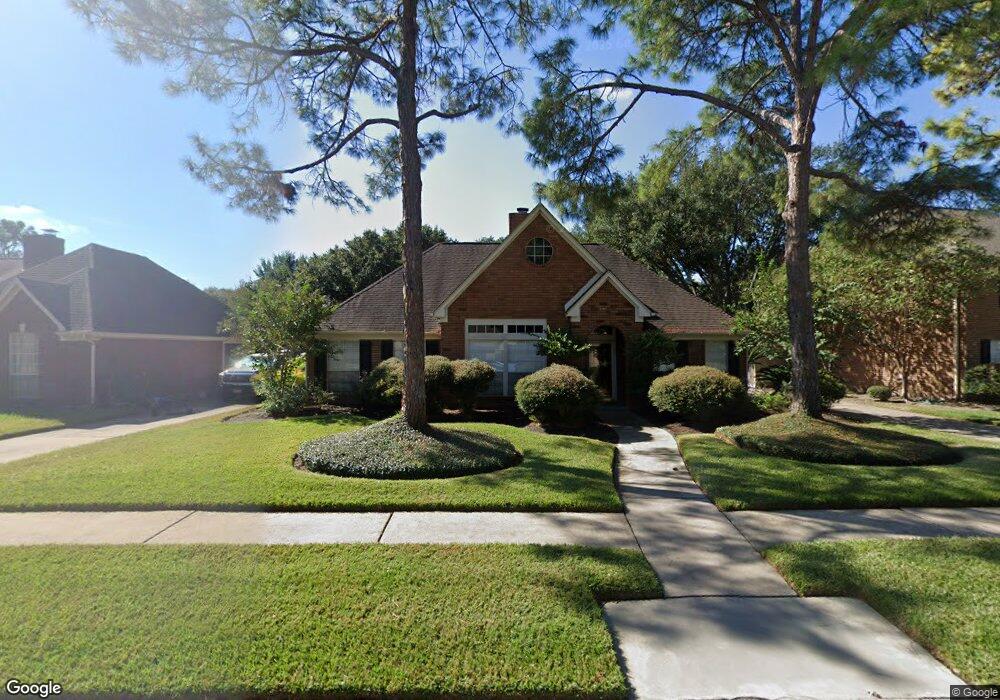
15927 Knolls Lodge Dr Houston, TX 77095
Copperfield NeighborhoodEstimated Value: $348,000 - $370,000
4
Beds
3
Baths
2,569
Sq Ft
$141/Sq Ft
Est. Value
About This Home
This home is located at 15927 Knolls Lodge Dr, Houston, TX 77095 and is currently estimated at $362,722, approximately $141 per square foot. 15927 Knolls Lodge Dr is a home located in Harris County with nearby schools including Lowery Elementary School, Aragon Middle School, and Langham Creek High School.
Ownership History
Date
Name
Owned For
Owner Type
Purchase Details
Closed on
Mar 12, 2015
Sold by
Ringnald John R and Ringnald Mary J
Bought by
Dunn Robert Oliver and Dunn Carol Horton
Current Estimated Value
Purchase Details
Closed on
Nov 16, 2009
Sold by
Apostolo Leon and Apostolo Theresa
Bought by
Ringnald John R and Ringnald Mary J
Home Financials for this Owner
Home Financials are based on the most recent Mortgage that was taken out on this home.
Original Mortgage
$182,532
Interest Rate
4.83%
Mortgage Type
FHA
Purchase Details
Closed on
Jun 8, 1995
Sold by
Schiller Karen H
Bought by
Apostolo Leon and Apostolo Theresa
Home Financials for this Owner
Home Financials are based on the most recent Mortgage that was taken out on this home.
Original Mortgage
$119,450
Interest Rate
8.17%
Purchase Details
Closed on
Mar 3, 1995
Sold by
Haywood Bradford H and Haywood Debra G
Bought by
Schiller Karen H
Create a Home Valuation Report for This Property
The Home Valuation Report is an in-depth analysis detailing your home's value as well as a comparison with similar homes in the area
Home Values in the Area
Average Home Value in this Area
Purchase History
| Date | Buyer | Sale Price | Title Company |
|---|---|---|---|
| Dunn Robert Oliver | -- | First American Title | |
| Ringnald John R | -- | First American Title | |
| Apostolo Leon | -- | Fidelity National Title | |
| Schiller Karen H | -- | Fidelity National Title |
Source: Public Records
Mortgage History
| Date | Status | Borrower | Loan Amount |
|---|---|---|---|
| Previous Owner | Ringnald John R | $182,532 | |
| Previous Owner | Apostolo Leon | $119,450 |
Source: Public Records
Tax History Compared to Growth
Tax History
| Year | Tax Paid | Tax Assessment Tax Assessment Total Assessment is a certain percentage of the fair market value that is determined by local assessors to be the total taxable value of land and additions on the property. | Land | Improvement |
|---|---|---|---|---|
| 2025 | $1,304 | $370,066 | $80,874 | $289,192 |
| 2024 | $1,304 | $370,726 | $73,319 | $297,407 |
| 2023 | $1,304 | $370,916 | $73,319 | $297,597 |
| 2022 | $6,503 | $345,256 | $48,880 | $296,376 |
| 2021 | $6,229 | $268,295 | $48,880 | $219,415 |
| 2020 | $6,237 | $261,535 | $37,771 | $223,764 |
| 2019 | $6,179 | $254,209 | $34,660 | $219,549 |
| 2018 | $1,902 | $227,588 | $34,660 | $192,928 |
| 2017 | $5,220 | $227,588 | $34,660 | $192,928 |
| 2016 | $5,220 | $227,588 | $34,660 | $192,928 |
| 2015 | $1,850 | $221,186 | $34,660 | $186,526 |
| 2014 | $1,850 | $213,274 | $34,660 | $178,614 |
Source: Public Records
Map
Nearby Homes
- 15854 Knolls Lodge Dr
- 16030 Royal Garden Dr
- 16026 Autumn Falls Ln
- 16114 Kintyre Point Rd
- 15918 Pinyon Creek Dr
- 16215 Cairngorm Ave
- 16215 Wemyss Bay Rd
- 8203 Green Devon Dr
- 15810 Knoll Lake Dr
- 7731 Club Lake Dr
- 7719 Woodlett Ct
- 8526 Hot Springs Dr
- 16319 Chimneystone Dr
- 16315 Battlecreek Dr
- 7511 Marble Glen Ln
- 16502 Rainbow Lake Rd
- 7419 Foxton Place Ct
- 8306 Lake Crystal Dr
- 15726 Echo Lodge Dr
- 7414 Starbridge Dr
- 15923 Knolls Lodge Dr
- 15931 Knolls Lodge Dr
- 7707 Penrose Point Dr
- 7711 Penrose Point Dr
- 15939 Knolls Lodge Dr
- 15919 Knolls Lodge Dr
- 7715 Penrose Point Dr
- 15926 Knolls Lodge Dr
- 15930 Knolls Lodge Dr
- 15922 Knolls Lodge Dr
- 15943 Knolls Lodge Dr
- 15934 Knolls Lodge Dr
- 15918 Knolls Lodge Dr
- 7702 Knolls Lodge Ct
- 15947 Knolls Lodge Dr
- 7730 Penrose Point Dr
- 7726 Penrose Point Dr
- 15914 Knolls Lodge Dr
- 7710 Penrose Point Dr
- 7702 Penrose Point Dr