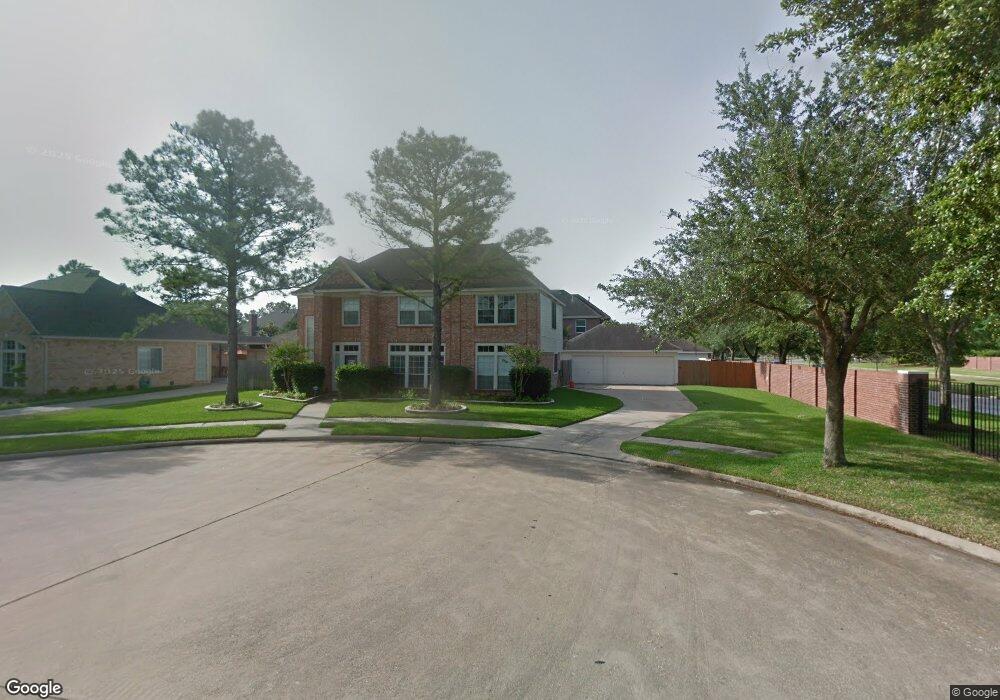
15927 Marwick Ct Houston, TX 77095
Estimated Value: $372,000 - $390,000
4
Beds
3
Baths
2,494
Sq Ft
$152/Sq Ft
Est. Value
About This Home
This home is located at 15927 Marwick Ct, Houston, TX 77095 and is currently estimated at $379,845, approximately $152 per square foot. 15927 Marwick Ct is a home located in Harris County with nearby schools including Fiest Elementary School, Labay Middle School, and Cypress Falls High School.
Ownership History
Date
Name
Owned For
Owner Type
Purchase Details
Closed on
Jul 9, 2014
Sold by
Dwight Frederick P
Bought by
Dwight Frederick P and Dwight Jennifer M
Current Estimated Value
Home Financials for this Owner
Home Financials are based on the most recent Mortgage that was taken out on this home.
Original Mortgage
$116,000
Outstanding Balance
$63,191
Interest Rate
4.18%
Mortgage Type
New Conventional
Estimated Equity
$316,654
Purchase Details
Closed on
Jul 28, 2005
Sold by
Thomas Michael A and Thomas Valerie E
Bought by
Dwight Frederick P
Home Financials for this Owner
Home Financials are based on the most recent Mortgage that was taken out on this home.
Original Mortgage
$130,400
Interest Rate
5.61%
Mortgage Type
Fannie Mae Freddie Mac
Create a Home Valuation Report for This Property
The Home Valuation Report is an in-depth analysis detailing your home's value as well as a comparison with similar homes in the area
Home Values in the Area
Average Home Value in this Area
Purchase History
| Date | Buyer | Sale Price | Title Company |
|---|---|---|---|
| Dwight Frederick P | -- | None Available | |
| Dwight Frederick P | -- | None Available | |
| Dwight Frederick P | -- | Texas American Title Company |
Source: Public Records
Mortgage History
| Date | Status | Borrower | Loan Amount |
|---|---|---|---|
| Open | Dwight Frederick P | $116,000 | |
| Closed | Dwight Frederick P | $116,000 | |
| Closed | Dwight Frederick P | $130,400 |
Source: Public Records
Tax History Compared to Growth
Tax History
| Year | Tax Paid | Tax Assessment Tax Assessment Total Assessment is a certain percentage of the fair market value that is determined by local assessors to be the total taxable value of land and additions on the property. | Land | Improvement |
|---|---|---|---|---|
| 2025 | $4,681 | $346,665 | $86,009 | $260,656 |
| 2024 | $4,681 | $375,380 | $71,749 | $303,631 |
| 2023 | $4,681 | $353,164 | $71,749 | $281,415 |
| 2022 | $6,218 | $285,096 | $54,368 | $230,728 |
| 2021 | $5,983 | $230,922 | $54,368 | $176,554 |
| 2020 | $6,045 | $223,957 | $45,010 | $178,947 |
| 2019 | $6,232 | $224,118 | $44,119 | $179,999 |
| 2018 | $2,123 | $215,536 | $44,119 | $171,417 |
| 2017 | $5,688 | $203,405 | $44,119 | $159,286 |
| 2016 | $5,688 | $203,405 | $44,119 | $159,286 |
| 2015 | $4,066 | $190,964 | $44,119 | $146,845 |
| 2014 | $4,066 | $180,609 | $44,119 | $136,490 |
Source: Public Records
Map
Nearby Homes
- 15906 Marwick Ct
- 8814 Sherina Park Dr
- 8818 Apple Mill Dr
- 16111 Aberdeen Forest Dr
- 16123 Aberdeen Forest Dr
- 9138 Shango Ln
- 15802 Aberdeen Trails Dr
- 16211 Green Smoke Dr
- 9111 Sunny Ridge Dr
- 15735 Jamie Lee Dr
- 8835 Aberdeen Park Dr
- 9303 Reston Grove Ln
- 9203 Appin Ct
- 9207 Appin Ct
- 8550 Sparkling Springs Dr
- 15954 Oak Mountain Dr
- 8806 Gas Light Village Dr
- 15627 Kentwater Ct
- 8526 Greenleaf Lake Dr
- 15610 Manorford Ct
- 15923 Marwick Ct
- 15914 Blaire Ct
- 15910 Blaire Ct
- 16002 Norwich Hill Ln
- 15919 Marwick Ct
- 15922 Marwick Ct
- 15906 Blaire Ct
- 15918 Marwick Ct
- 8834 Sherina Park Dr
- 15911 Marwick Ct
- 8830 Sherina Park Dr
- 8838 Sherina Park Dr
- 8826 Sherina Park Dr
- 15914 Marwick Ct
- 15902 Blaire Ct
- 15931 Aberdeen Trails Dr
- 8822 Sherina Park Dr
- 15911 Blaire Ct
- 15927 Aberdeen Trails Dr
- 15915 Blaire Ct