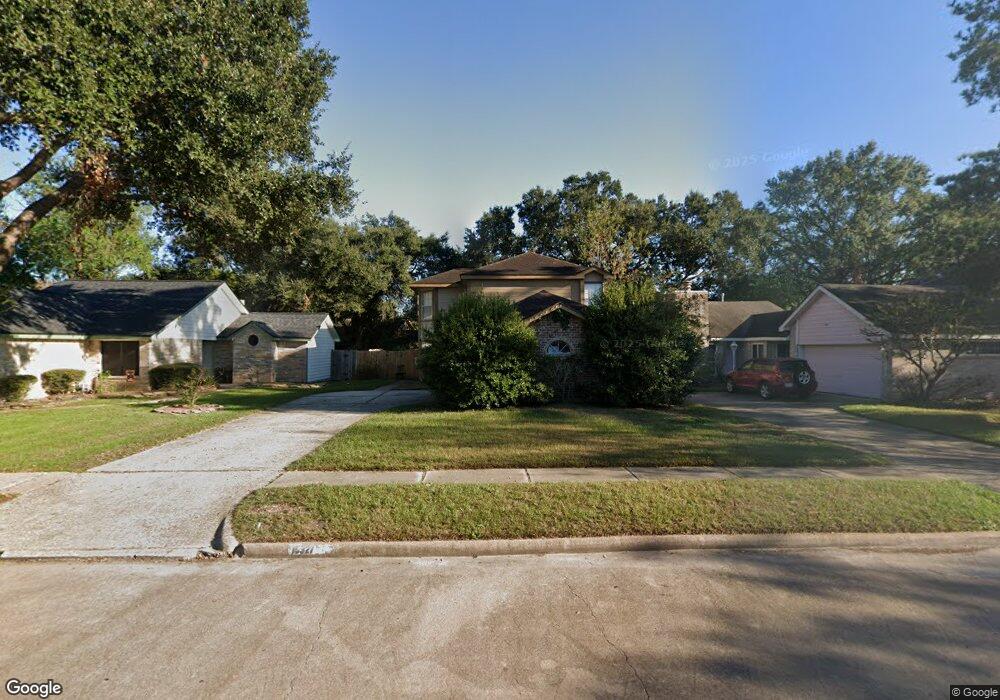
15927 Oak Mountain Dr Houston, TX 77095
Copperfield NeighborhoodEstimated Value: $254,177 - $286,000
3
Beds
3
Baths
1,813
Sq Ft
$152/Sq Ft
Est. Value
About This Home
This home is located at 15927 Oak Mountain Dr, Houston, TX 77095 and is currently estimated at $274,794, approximately $151 per square foot. 15927 Oak Mountain Dr is a home located in Harris County with nearby schools including Fiest Elementary School, Labay Middle School, and Cypress Falls High School.
Ownership History
Date
Name
Owned For
Owner Type
Purchase Details
Closed on
Feb 26, 2014
Sold by
Srp Sub Llc
Bought by
Tarbert Llc
Current Estimated Value
Purchase Details
Closed on
Nov 20, 2012
Sold by
Murphy Edward L and Murphy Sharon M
Bought by
Srp Sub Llc
Purchase Details
Closed on
Sep 18, 2009
Sold by
Smith William A and Smith Mary A
Bought by
Murphy Edward L and Weber Sharon M
Purchase Details
Closed on
Mar 6, 2007
Sold by
Ater Rosalie D and Clayton Ater Susan
Bought by
Smith William Alan
Purchase Details
Closed on
Jul 17, 1995
Sold by
Smith Richard and Smith Myra
Bought by
Clayton Ater Susan and Ater Rosalie D
Home Financials for this Owner
Home Financials are based on the most recent Mortgage that was taken out on this home.
Original Mortgage
$69,800
Interest Rate
7.54%
Mortgage Type
FHA
Create a Home Valuation Report for This Property
The Home Valuation Report is an in-depth analysis detailing your home's value as well as a comparison with similar homes in the area
Home Values in the Area
Average Home Value in this Area
Purchase History
| Date | Buyer | Sale Price | Title Company |
|---|---|---|---|
| Tarbert Llc | -- | -- | |
| Tarbert Llc | -- | -- | |
| Srp Sub Llc | -- | None Available | |
| Murphy Edward L | -- | Star Tex Title Company | |
| Smith William Alan | $81,000 | None Available | |
| Clayton Ater Susan | -- | -- |
Source: Public Records
Mortgage History
| Date | Status | Borrower | Loan Amount |
|---|---|---|---|
| Previous Owner | Clayton Ater Susan | $69,800 |
Source: Public Records
Tax History Compared to Growth
Tax History
| Year | Tax Paid | Tax Assessment Tax Assessment Total Assessment is a certain percentage of the fair market value that is determined by local assessors to be the total taxable value of land and additions on the property. | Land | Improvement |
|---|---|---|---|---|
| 2025 | $4,786 | $252,444 | $57,503 | $194,941 |
| 2024 | $4,786 | $234,603 | $48,032 | $186,571 |
| 2023 | $4,786 | $227,304 | $48,032 | $179,272 |
| 2022 | $5,125 | $232,584 | $34,276 | $198,308 |
| 2021 | $4,427 | $190,711 | $34,276 | $156,435 |
| 2020 | $4,317 | $181,028 | $28,639 | $152,389 |
| 2019 | $4,085 | $165,500 | $28,639 | $136,861 |
| 2018 | $2,030 | $141,000 | $28,639 | $112,361 |
| 2017 | $3,234 | $141,000 | $28,639 | $112,361 |
| 2016 | $3,320 | $148,705 | $28,639 | $120,066 |
| 2015 | $1,903 | $148,705 | $28,639 | $120,066 |
| 2014 | $1,903 | $126,001 | $22,099 | $103,902 |
Source: Public Records
Map
Nearby Homes
- 15954 Oak Mountain Dr
- 8550 Sparkling Springs Dr
- 8306 Lake Crystal Dr
- 8818 Apple Mill Dr
- 8526 Hot Springs Dr
- 8526 Greenleaf Lake Dr
- 15735 Jamie Lee Dr
- 16111 Aberdeen Forest Dr
- 8426 Laurel Trails Dr
- 16123 Aberdeen Forest Dr
- 8814 Sherina Park Dr
- 8550 Waiting Spring Ln
- 15802 Aberdeen Trails Dr
- 15906 Marwick Ct
- 15918 Pinyon Creek Dr
- 15634 Haleys Landing Ln
- 16211 Green Smoke Dr
- 15610 Manorford Ct
- 15627 Kentwater Ct
- 15610 Tarpon Springs Ct
- 15923 Oak Mountain Dr
- 15931 Oak Mountain Dr
- 15919 Oak Mountain Dr
- 15935 Oak Mountain Dr
- 8623 Timbercraft Dr
- 8619 Timbercraft Dr
- 8615 Timbercraft Dr
- 8627 Timbercraft Dr
- 15915 Oak Mountain Dr
- 15939 Oak Mountain Dr
- 15926 Oak Mountain Dr
- 8611 Timbercraft Dr
- 15922 Oak Mountain Dr
- 15934 Oak Mountain Dr
- 15918 Oak Mountain Dr
- 15943 Oak Mountain Dr
- 15911 Oak Mountain Dr
- 8607 Timbercraft Dr
- 8631 Timbercraft Dr
- 15938 Oak Mountain Dr