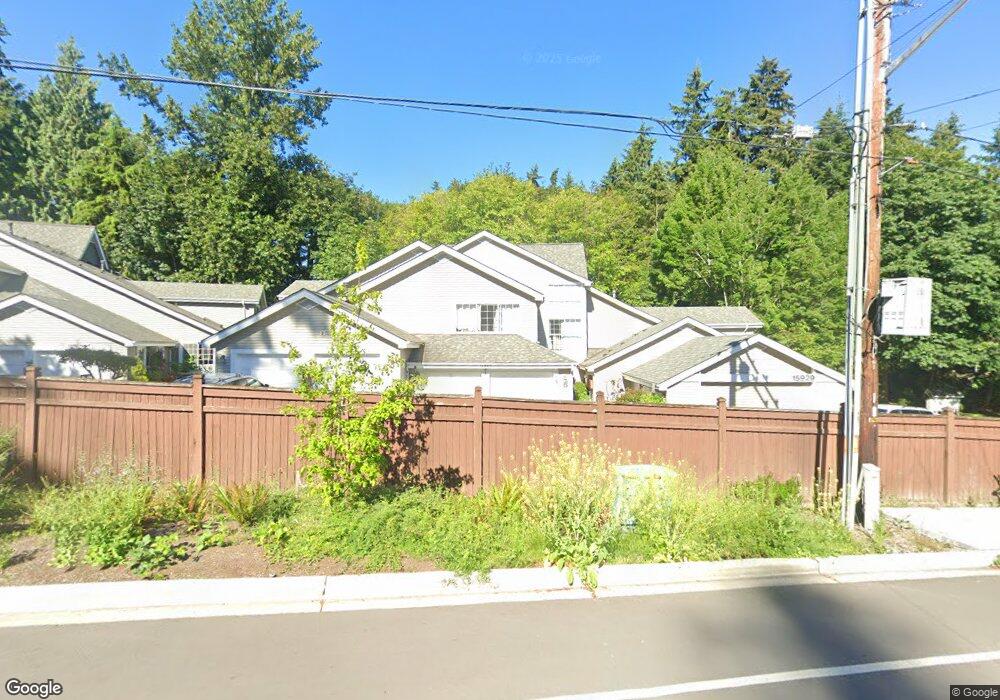
15929 67th Ln NE Unit 51 Kenmore, WA 98028
Moorlands NeighborhoodEstimated Value: $716,000 - $910,000
3
Beds
3
Baths
1,806
Sq Ft
$436/Sq Ft
Est. Value
About This Home
This home is located at 15929 67th Ln NE Unit 51, Kenmore, WA 98028 and is currently estimated at $788,163, approximately $436 per square foot. 15929 67th Ln NE Unit 51 is a home located in King County with nearby schools including Arrowhead Elementary School, Northshore Junior High School, and Inglemoor High School.
Ownership History
Date
Name
Owned For
Owner Type
Purchase Details
Closed on
May 18, 2021
Sold by
Jones Wenyi T and Liu Yuying
Bought by
Stoforandov Aleksandr and Tsives Tatiana
Current Estimated Value
Home Financials for this Owner
Home Financials are based on the most recent Mortgage that was taken out on this home.
Original Mortgage
$589,000
Outstanding Balance
$533,781
Interest Rate
3.1%
Mortgage Type
New Conventional
Estimated Equity
$254,382
Purchase Details
Closed on
Sep 19, 2018
Sold by
Jones Catherine N
Bought by
Jones Wenyi T and Liu Yuying
Home Financials for this Owner
Home Financials are based on the most recent Mortgage that was taken out on this home.
Original Mortgage
$304,500
Interest Rate
4.5%
Purchase Details
Closed on
Aug 28, 1997
Sold by
Jacks Herbert G and Jacks Natalia
Bought by
Jones Ellis E and Jones Catherine N
Purchase Details
Closed on
Jun 1, 1992
Sold by
Lifestyle Development Inc
Bought by
Jacks Herbert G and Jacks Natalia
Create a Home Valuation Report for This Property
The Home Valuation Report is an in-depth analysis detailing your home's value as well as a comparison with similar homes in the area
Home Values in the Area
Average Home Value in this Area
Purchase History
| Date | Buyer | Sale Price | Title Company |
|---|---|---|---|
| Stoforandov Aleksandr | -- | Chicago Title Company Of Wa | |
| Stoforandov Alexander | $625,000 | Chicago Title Company Of Wa | |
| Jones Wenyi T | $435,000 | Chicago Title Company | |
| Jones Ellis E | $210,000 | First American Title Ins Co | |
| Jacks Herbert G | $192,000 | -- |
Source: Public Records
Mortgage History
| Date | Status | Borrower | Loan Amount |
|---|---|---|---|
| Open | Stoforandov Alexander | $589,000 | |
| Previous Owner | Jones Wenyi T | $304,500 |
Source: Public Records
Tax History Compared to Growth
Tax History
| Year | Tax Paid | Tax Assessment Tax Assessment Total Assessment is a certain percentage of the fair market value that is determined by local assessors to be the total taxable value of land and additions on the property. | Land | Improvement |
|---|---|---|---|---|
| 2024 | $7,087 | $674,000 | $143,700 | $530,300 |
| 2023 | $5,744 | $723,000 | $158,100 | $564,900 |
| 2022 | $5,011 | $611,000 | $136,500 | $474,500 |
| 2021 | $5,239 | $431,000 | $129,300 | $301,700 |
| 2020 | $5,199 | $417,000 | $179,600 | $237,400 |
| 2018 | $4,904 | $461,000 | $158,100 | $302,900 |
| 2017 | $3,798 | $390,000 | $150,900 | $239,100 |
| 2016 | $3,760 | $300,000 | $143,700 | $156,300 |
| 2015 | $3,825 | $290,000 | $129,300 | $160,700 |
| 2014 | -- | $284,000 | $129,300 | $154,700 |
| 2013 | -- | $261,000 | $122,100 | $138,900 |
Source: Public Records
Map
Nearby Homes
- 15929 67th Ln NE Unit 3
- 15925 70th Ave NE
- 6529 NE Arrowhead Dr
- 6808 NE 165th St
- 7223 NE 160th St
- 15519 73rd Place NE
- 6816 NE 153rd Place Unit D
- 16004 74th Ave NE
- 15000 Juanita Dr NE Unit 307
- 15000 Juanita Dr NE Unit 405
- 6831 NE 170th St Unit 306
- 15029 66th Ct NE
- 16972 65th Ln NE
- 14933 73rd Ave NE
- 7609 NE 155th St
- 16422 76th Ave NE
- 16035 Inglewood Rd NE
- 16 Xxx 76th Place NE
- 7245 NE 170th St
- 16925 Inglewood Rd NE Unit B305
- 15929 67th Ln NE Unit 74
- 15929 67th Ln NE Unit 71
- 15929 67th Ln NE Unit 6
- 15929 67th Ln NE Unit 21
- 15929 67th Ln NE Unit 61
- 15929 67th Ln NE Unit 53
- 15929 67th Ln NE Unit 5
- 15929 67th Ln NE Unit 4
- 15929 67th Ln NE Unit 2
- 15929 67th Ln NE Unit 1
- 15929 67th Ln NE Unit 23
- 15929 67th Ln NE Unit 2
- 15929 67th Ln NE Unit 3
- 15929 67th Ln NE Unit 32
- 15929 67th Ln NE Unit 31
- 15929 67th Ln NE Unit 4
- 15929 67th Ln NE Unit 43
- 15929 67th Ln NE Unit 42
- 15929 67th Ln NE Unit 41
- 15929 67th Ln NE Unit 75