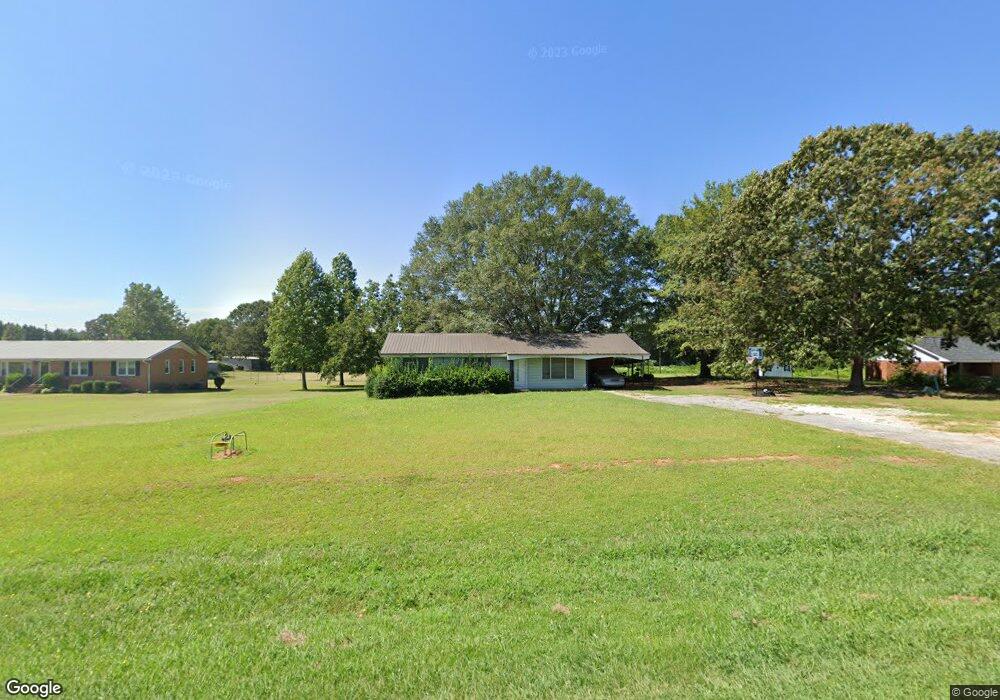
1593 Bowman Hwy Elberton, GA 30635
Estimated Value: $174,121 - $223,000
3
Beds
2
Baths
1,344
Sq Ft
$141/Sq Ft
Est. Value
About This Home
This home is located at 1593 Bowman Hwy, Elberton, GA 30635 and is currently estimated at $189,530, approximately $141 per square foot. 1593 Bowman Hwy is a home located in Elbert County with nearby schools including Elbert County Elementary School, Elbert County Primary School, and Elbert County Middle School.
Ownership History
Date
Name
Owned For
Owner Type
Purchase Details
Closed on
Nov 30, 2018
Sold by
Lord James Floyd
Bought by
Mcglockling Nathaniel Lee
Current Estimated Value
Home Financials for this Owner
Home Financials are based on the most recent Mortgage that was taken out on this home.
Original Mortgage
$84,848
Outstanding Balance
$74,093
Interest Rate
4.8%
Mortgage Type
New Conventional
Estimated Equity
$115,437
Purchase Details
Closed on
Aug 15, 2011
Sold by
Lord Steve Garnett
Bought by
Lord James F
Purchase Details
Closed on
Dec 2, 2010
Sold by
Lord Naomi Maliece
Bought by
Lord James F and Vaughn Jennifer Lord
Purchase Details
Closed on
Oct 1, 1976
Purchase Details
Closed on
Aug 1, 1976
Purchase Details
Closed on
Aug 1, 1971
Purchase Details
Closed on
Oct 1, 1965
Purchase Details
Closed on
Feb 1, 1964
Create a Home Valuation Report for This Property
The Home Valuation Report is an in-depth analysis detailing your home's value as well as a comparison with similar homes in the area
Home Values in the Area
Average Home Value in this Area
Purchase History
| Date | Buyer | Sale Price | Title Company |
|---|---|---|---|
| Mcglockling Nathaniel Lee | $81,200 | -- | |
| Lord James F | $17,000 | -- | |
| Lord James F | $17,000 | -- | |
| Lord James F | -- | -- | |
| Lord James F | -- | -- | |
| -- | $21,700 | -- | |
| -- | -- | -- | |
| -- | -- | -- | |
| -- | $15,400 | -- | |
| -- | $1,100 | -- |
Source: Public Records
Mortgage History
| Date | Status | Borrower | Loan Amount |
|---|---|---|---|
| Open | Mcglockling Nathaniel Lee | $84,848 |
Source: Public Records
Tax History Compared to Growth
Tax History
| Year | Tax Paid | Tax Assessment Tax Assessment Total Assessment is a certain percentage of the fair market value that is determined by local assessors to be the total taxable value of land and additions on the property. | Land | Improvement |
|---|---|---|---|---|
| 2024 | $1,137 | $47,438 | $2,502 | $44,936 |
| 2023 | $1,137 | $47,438 | $2,502 | $44,936 |
| 2022 | $835 | $34,813 | $1,489 | $33,324 |
| 2021 | $836 | $34,813 | $1,489 | $33,324 |
| 2020 | $724 | $26,631 | $1,191 | $25,440 |
| 2019 | $752 | $26,631 | $1,191 | $25,440 |
| 2018 | $775 | $26,631 | $1,191 | $25,440 |
| 2017 | $701 | $22,301 | $1,191 | $21,110 |
| 2016 | $653 | $22,255 | $1,191 | $21,064 |
| 2015 | -- | $22,255 | $1,191 | $21,064 |
| 2014 | -- | $22,255 | $1,191 | $21,064 |
| 2013 | -- | $22,255 | $1,191 | $21,064 |
Source: Public Records
Map
Nearby Homes
- 1504 Woodyard Rd
- 1724 Martin Villa Rd
- 1621 Dickerson Rd
- 0 Fortson Dr
- 15693 Tanglewood Dr
- 15 Emmaus Dr
- 5 Emmaus Dr
- 2 Emmaus Dr
- 20 Emmaus Dr
- 14 Emmaus Dr
- 21 Emmaus Dr
- 19 Emmaus Dr
- 11 Emmaus Dr
- 4 Emmaus Dr
- 8 Emmaus Dr
- 16 Emmaus Dr
- 0 Cromer Rd
- 0 Henry Moon Dr Unit 10452056
- 1 Powerhouse Dr
- 1511 N Rainbow Dr
- 1597 Bowman Hwy
- 1585 Bowman Hwy
- 1581 Bowman Hwy
- 1519 Woodyard Rd
- 1605 Bowman Hwy NW
- 1571 Bowman Hwy
- 1571 Bowman Hwy
- 1920 Indian Springs Rd
- 1518 Woodyard Rd
- 1924 Indian Springs Rd
- 1541 Woodyard Rd
- 1563 Bowman Hwy
- 1503 Nowhere Rd
- 0 Indian Springs Rd
- 1515 Nowhere Rd
- 1700 Bowman Hwy
- 1904 Indian Springs Rd
- 1928 Indian Springs Rd
- 0 Nowhere Rd Unit 8188748
- 0 Nowhere Rd