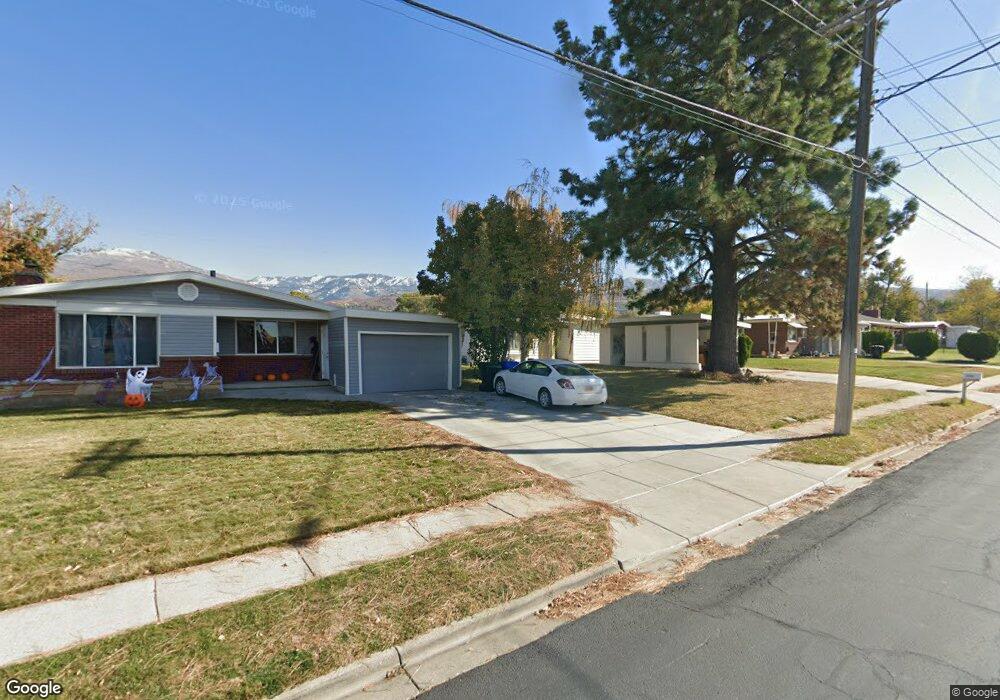
1593 S 200 W Bountiful, UT 84010
Estimated Value: $413,634 - $496,000
3
Beds
1
Bath
1,286
Sq Ft
$340/Sq Ft
Est. Value
About This Home
This home is located at 1593 S 200 W, Bountiful, UT 84010 and is currently estimated at $437,659, approximately $340 per square foot. 1593 S 200 W is a home located in Davis County with nearby schools including Bountiful Elementary School, Mueller Park Junior High School, and Bountiful High School.
Ownership History
Date
Name
Owned For
Owner Type
Purchase Details
Closed on
Aug 28, 2024
Sold by
Huff Matthew James and Ralph J Huff Revocable Trust
Bought by
Gaiser Blake A and Whyte Olivia L
Current Estimated Value
Home Financials for this Owner
Home Financials are based on the most recent Mortgage that was taken out on this home.
Original Mortgage
$375,991
Outstanding Balance
$371,654
Interest Rate
6.77%
Mortgage Type
FHA
Estimated Equity
$66,005
Purchase Details
Closed on
Jun 26, 2008
Sold by
Huff Ralph J
Bought by
Huff Ralph J
Create a Home Valuation Report for This Property
The Home Valuation Report is an in-depth analysis detailing your home's value as well as a comparison with similar homes in the area
Purchase History
| Date | Buyer | Sale Price | Title Company |
|---|---|---|---|
| Gaiser Blake A | -- | None Listed On Document | |
| Huff Ralph J | -- | None Available |
Source: Public Records
Mortgage History
| Date | Status | Borrower | Loan Amount |
|---|---|---|---|
| Open | Gaiser Blake A | $375,991 |
Source: Public Records
Tax History
| Year | Tax Paid | Tax Assessment Tax Assessment Total Assessment is a certain percentage of the fair market value that is determined by local assessors to be the total taxable value of land and additions on the property. | Land | Improvement |
|---|---|---|---|---|
| 2025 | $1,794 | $198,000 | $106,850 | $91,150 |
| 2024 | $2,237 | $192,500 | $95,774 | $96,726 |
| 2023 | $2,272 | $332,000 | $219,939 | $112,061 |
| 2022 | $2,318 | $179,300 | $120,014 | $59,286 |
| 2021 | $1,808 | $252,000 | $157,080 | $94,920 |
| 2020 | $1,595 | $222,000 | $134,191 | $87,809 |
| 2019 | $1,610 | $219,000 | $139,998 | $79,002 |
| 2018 | $1,493 | $199,000 | $137,192 | $61,808 |
| 2016 | $1,258 | $90,475 | $57,424 | $33,051 |
| 2015 | $1,221 | $82,775 | $57,424 | $25,351 |
| 2014 | $1,374 | $97,529 | $57,424 | $40,105 |
| 2013 | -- | $92,405 | $37,353 | $55,052 |
Source: Public Records
Map
Nearby Homes
- 1350 S 200 W
- 1314 S 200 W Unit 19
- 1940 S 200 W Unit 3
- 1820 S 50 W
- 1950 S 200 W Unit 32
- 141 E 1650 S
- 2 E Wicker Ln
- 1016 S 400 W
- 109 W 900 S
- 2095 S Main St Unit 13
- 2064 S Orchard Dr
- 2183 Penman Ln
- 41 E 2200 S
- 360 W 800 S
- 288 E 1650 S
- 990 S 500 W
- 188 E 2050 S Unit D3
- 304 W 2300 S
- 285 E 1100 S
- 380 E 1500 S
Your Personal Tour Guide
Ask me questions while you tour the home.