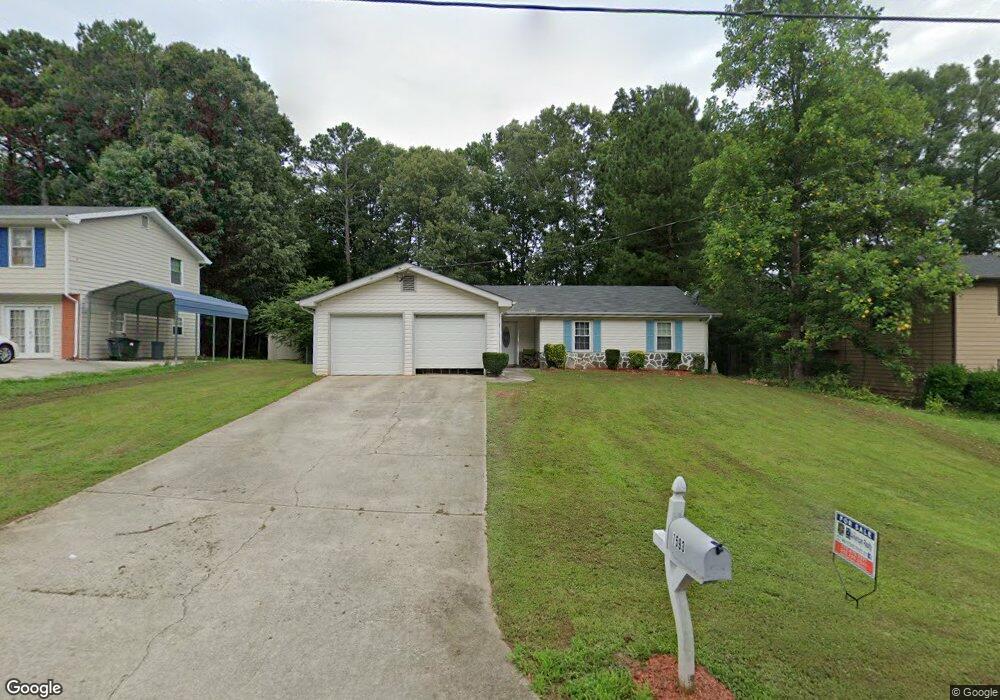
1593 Sugarplum Dr SW Conyers, GA 30094
Estimated Value: $224,927 - $265,000
3
Beds
2
Baths
1,477
Sq Ft
$161/Sq Ft
Est. Value
About This Home
This home is located at 1593 Sugarplum Dr SW, Conyers, GA 30094 and is currently estimated at $237,982, approximately $161 per square foot. 1593 Sugarplum Dr SW is a home located in Rockdale County with nearby schools including Sims Elementary School, Edwards Middle School, and Heritage High School.
Ownership History
Date
Name
Owned For
Owner Type
Purchase Details
Closed on
Jul 25, 2019
Sold by
Brantley Bennie P
Bought by
Yamasa Co Ltd
Current Estimated Value
Purchase Details
Closed on
May 21, 2012
Sold by
Grant Weygand H
Bought by
Brantley Bennie P
Purchase Details
Closed on
Sep 28, 2007
Sold by
Jones Reginald and Jones Pangerla
Bought by
Grant Weygand H
Home Financials for this Owner
Home Financials are based on the most recent Mortgage that was taken out on this home.
Original Mortgage
$111,069
Interest Rate
6.49%
Mortgage Type
FHA
Purchase Details
Closed on
Aug 18, 1999
Sold by
Jones Reginald
Bought by
Jones Pangerla
Create a Home Valuation Report for This Property
The Home Valuation Report is an in-depth analysis detailing your home's value as well as a comparison with similar homes in the area
Home Values in the Area
Average Home Value in this Area
Purchase History
| Date | Buyer | Sale Price | Title Company |
|---|---|---|---|
| Yamasa Co Ltd | $130,000 | -- | |
| Brantley Bennie P | $30,000 | -- | |
| Grant Weygand H | $112,400 | -- | |
| Jones Pangerla | -- | -- |
Source: Public Records
Mortgage History
| Date | Status | Borrower | Loan Amount |
|---|---|---|---|
| Previous Owner | Grant Weygand H | $111,069 |
Source: Public Records
Tax History Compared to Growth
Tax History
| Year | Tax Paid | Tax Assessment Tax Assessment Total Assessment is a certain percentage of the fair market value that is determined by local assessors to be the total taxable value of land and additions on the property. | Land | Improvement |
|---|---|---|---|---|
| 2024 | $3,330 | $82,684 | $14,612 | $68,072 |
| 2023 | $3,446 | $83,520 | $14,760 | $68,760 |
| 2022 | $2,668 | $63,920 | $11,120 | $52,800 |
| 2021 | $2,220 | $53,320 | $8,920 | $44,400 |
| 2020 | $2,068 | $48,120 | $7,480 | $40,640 |
| 2019 | $1,741 | $38,400 | $6,760 | $31,640 |
| 2018 | $1,446 | $31,680 | $4,560 | $27,120 |
| 2017 | $1,434 | $31,120 | $4,560 | $26,560 |
| 2016 | $1,434 | $31,120 | $4,560 | $26,560 |
| 2015 | $1,085 | $23,440 | $3,120 | $20,320 |
| 2014 | $1,096 | $23,440 | $3,120 | $20,320 |
| 2013 | -- | $26,880 | $6,000 | $20,880 |
Source: Public Records
Map
Nearby Homes
- 1461 Cherry Hill Rd SW
- 1593 Cherry Hill Ln SW
- 1598 Cherry Hill Ln SW Unit 5
- 1806 Mccollum Rd SW
- 1624 Sugarmaple Ln SW
- 1675 Mccollum Rd SW
- 170 Old Mill Trail SW
- 2305 Lochinver Ln SW
- 2370 Ebenezer Rd SE
- 2203 Liberty Ln SW Unit 2
- 2067 Ebenezer Rd SW
- 2315 Lochinver Ln SW
- 325 Yukon Dr Unit 66
- 335 Yukon Dr Unit 61
- 341 Yukon Dr Unit 58
- 4980 SE West Lake Dr
- 4811 SE West Lake Dr
- 2325 Lochinver Ln SW
- 2329 Lochinver Ln SW
- 1779 Granade Rd SW
- 1593 Sugar Plum Dr SW
- 1597 Sugar Plum Dr SW
- 1589 Sugar Plum Dr SW
- 1601 Sugar Plum Dr SW
- 1702 Sugarplum Ct SW
- 0 Sugar Plum Dr SW Unit 8876699
- 1704 Sugarplum Ct SW Unit 4
- 1632 Sugarmaple Dr SW Unit 3
- 1596 Sugar Plum Dr SW Unit 3
- 1600 Sugar Plum Dr SW
- 1634 Sugarmaple Dr SW Unit 4
- 1592 Sugar Plum Dr SW Unit 3
- 1605 Sugar Plum Dr SW
- 1604 Sugar Plum Dr SW Unit 3
- 1705 Sugarplum Ct SW
- 1630 Sugarmaple Dr SW
- 0 Sugarmaple Dr SW Unit 8391972
- 1700 Sugarplum Ct SW
- 1608 Sugar Plum Dr SW