Estimated Value: $431,000 - $474,000
5
Beds
2
Baths
1,312
Sq Ft
$343/Sq Ft
Est. Value
About This Home
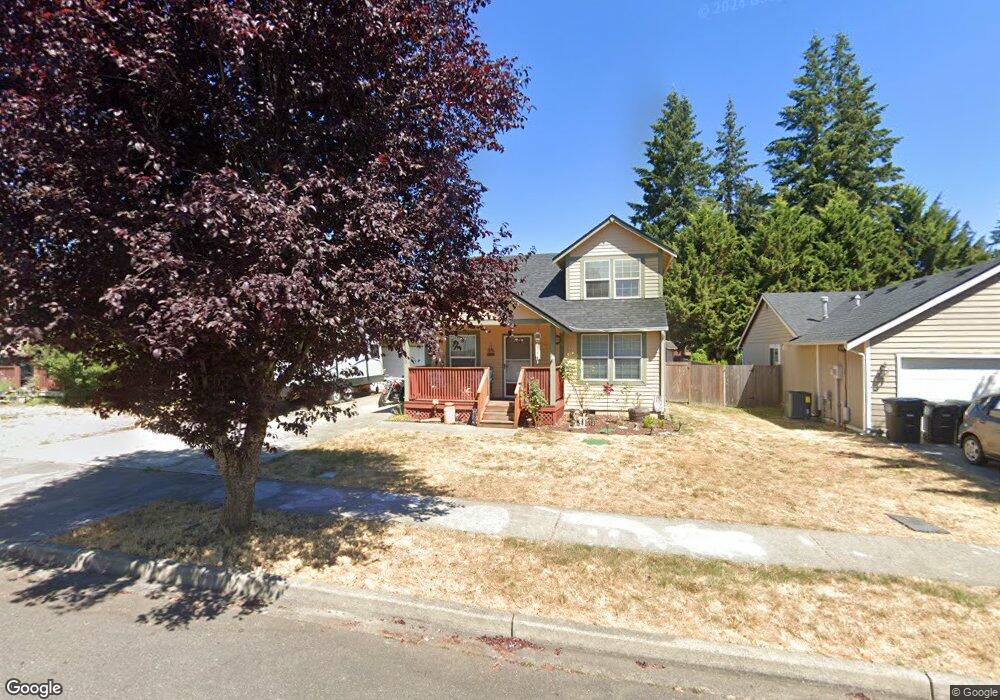
This home is located at 15930 Quail Meadows Ct SE, Yelm, WA 98597 and is currently estimated at $450,008, approximately $342 per square foot. 15930 Quail Meadows Ct SE is a home located in Thurston County with nearby schools including Mill Pond Elementary School, Ridgeline Middle School, and Yelm High School.
Ownership History
Date
Name
Owned For
Owner Type
Purchase Details
Closed on
May 8, 2001
Sold by
Rudnitskiy Dimitriy and Rudnitskiy Anna
Bought by
Thornton Dennis W and Thornton Lisa M
Current Estimated Value
Home Financials for this Owner
Home Financials are based on the most recent Mortgage that was taken out on this home.
Original Mortgage
$112,200
Outstanding Balance
$41,461
Interest Rate
6.89%
Mortgage Type
VA
Estimated Equity
$408,547
Purchase Details
Closed on
Aug 29, 1998
Sold by
Northwest Housing Development
Bought by
Rudnitskiy Dmitriy and Rudnitskiy Anna
Home Financials for this Owner
Home Financials are based on the most recent Mortgage that was taken out on this home.
Original Mortgage
$102,900
Interest Rate
6.93%
Purchase Details
Closed on
Apr 1, 1998
Sold by
Woodcrest Homes Inc
Bought by
Northwest Housing Development
Create a Home Valuation Report for This Property
The Home Valuation Report is an in-depth analysis detailing your home's value as well as a comparison with similar homes in the area
Home Values in the Area
Average Home Value in this Area
Purchase History
| Date | Buyer | Sale Price | Title Company |
|---|---|---|---|
| Thornton Dennis W | $110,000 | Chicago Title Insurance Co | |
| Rudnitskiy Dmitriy | $30,000 | Transnation Title Insurance | |
| Northwest Housing Development | -- | Commonwealth Title Co |
Source: Public Records
Mortgage History
| Date | Status | Borrower | Loan Amount |
|---|---|---|---|
| Open | Thornton Dennis W | $112,200 | |
| Previous Owner | Rudnitskiy Dmitriy | $102,900 |
Source: Public Records
Tax History Compared to Growth
Tax History
| Year | Tax Paid | Tax Assessment Tax Assessment Total Assessment is a certain percentage of the fair market value that is determined by local assessors to be the total taxable value of land and additions on the property. | Land | Improvement |
|---|---|---|---|---|
| 2024 | $3,527 | $379,100 | $132,800 | $246,300 |
| 2023 | $3,527 | $361,200 | $108,600 | $252,600 |
| 2022 | $3,178 | $353,900 | $75,400 | $278,500 |
| 2021 | $2,992 | $288,500 | $81,300 | $207,200 |
| 2020 | $2,732 | $236,100 | $60,700 | $175,400 |
| 2019 | $2,093 | $210,600 | $50,500 | $160,100 |
| 2018 | $2,267 | $167,100 | $25,000 | $142,100 |
| 2017 | $2,013 | $155,400 | $24,500 | $130,900 |
| 2016 | $1,862 | $144,500 | $32,600 | $111,900 |
| 2014 | -- | $135,600 | $31,300 | $104,300 |
Source: Public Records
Map
Nearby Homes
- 15832 Woodland Ct SE Unit 15
- 15826 Woodland Ct SE Unit 14
- 9413 Chief Leschi St SE Unit 8
- 9419 Chief Leschi St SE Unit 7
- 9450 Chief Leschi St SE Unit 29
- 9437 Chief Leschi St SE Unit 4
- 15730 91st Way SE
- 16300 Jenkins Ave SE
- 16306 Jenkins Ave SE
- 9714 Hay St SE
- 9711 Brown St SE
- 9710 Brown St SE
- 9717 Brown St SE
- 9720 Hay St SE
- 9723 Brown St SE
- 9727 Hay St SE
- 9733 Hay St SE
- 9732 Hay St SE
- 9745 Hay St SE
- 9738 Hay St SE
- 15934 Quail Meadows Ct SE
- 15926 Quail Meadows Ct SE
- 15922 Quail Meadows Ct SE
- 1107 Rhoton Ct NW
- 15938 Quail Meadows Ct SE
- 1108 Rhoton Ct NW
- 1106 Rhoton Ct NW
- 15929 Quail Meadows Ct SE
- 15925 Quail Meadows Ct SE
- 15942 Quail Meadows Ct SE
- 15933 Quail Meadows Ct SE
- 1109 Rhoton Ct NW
- 15918 Quail Meadows Ct SE
- 1105 Rhoton Ct NW
- 15937 Quail Meadows Ct SE
- 15921 Quail Meadows Ct SE
- 15946 Quail Meadows Ct SE
- 1110 Rhoton Ct NW
- 15941 Quail Meadows Ct SE
- 1104 Rhoton Ct NW