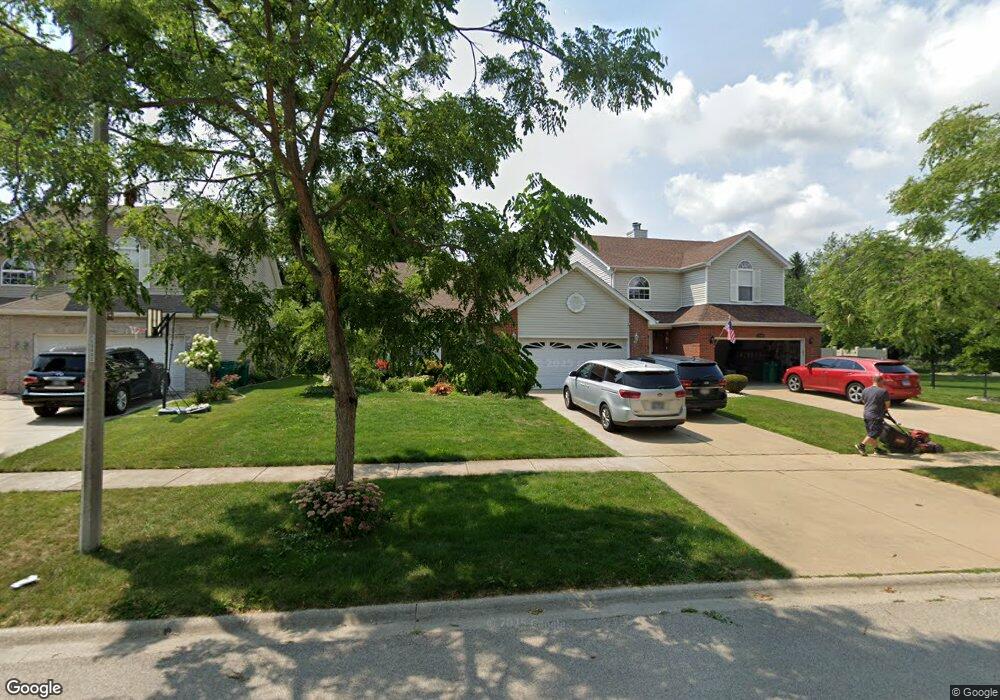
15932 Fairfield Dr Unit 1 Plainfield, IL 60586
East Plainfield NeighborhoodEstimated Value: $311,504 - $339,000
4
Beds
3
Baths
1,486
Sq Ft
$221/Sq Ft
Est. Value
About This Home
This home is located at 15932 Fairfield Dr Unit 1, Plainfield, IL 60586 and is currently estimated at $329,126, approximately $221 per square foot. 15932 Fairfield Dr Unit 1 is a home located in Will County with nearby schools including Central Elementary School, Indian Trail Middle School, and Plainfield Central High School.
Ownership History
Date
Name
Owned For
Owner Type
Purchase Details
Closed on
Aug 8, 2023
Sold by
Kosior Jeannette I
Bought by
Trust Number 8002392345
Current Estimated Value
Home Financials for this Owner
Home Financials are based on the most recent Mortgage that was taken out on this home.
Original Mortgage
$272,650
Outstanding Balance
$266,654
Interest Rate
7%
Mortgage Type
New Conventional
Estimated Equity
$62,472
Purchase Details
Closed on
Jul 13, 2007
Sold by
Slomiany Virginia
Bought by
Kosior James A and Kosior Jeanette I
Home Financials for this Owner
Home Financials are based on the most recent Mortgage that was taken out on this home.
Original Mortgage
$100,000
Interest Rate
6.72%
Mortgage Type
Purchase Money Mortgage
Purchase Details
Closed on
Jun 14, 2000
Sold by
Schelling Development Corp
Bought by
Slomiany Harry and Slomiany Virginia
Create a Home Valuation Report for This Property
The Home Valuation Report is an in-depth analysis detailing your home's value as well as a comparison with similar homes in the area
Home Values in the Area
Average Home Value in this Area
Purchase History
| Date | Buyer | Sale Price | Title Company |
|---|---|---|---|
| Trust Number 8002392345 | $287,000 | None Listed On Document | |
| Kosior James A | $225,000 | First American Title Ins Co | |
| Slomiany Harry | $170,000 | Chicago Title Insurance Co |
Source: Public Records
Mortgage History
| Date | Status | Borrower | Loan Amount |
|---|---|---|---|
| Open | Trust Number 8002392345 | $272,650 | |
| Previous Owner | Kosior James A | $100,000 |
Source: Public Records
Tax History Compared to Growth
Tax History
| Year | Tax Paid | Tax Assessment Tax Assessment Total Assessment is a certain percentage of the fair market value that is determined by local assessors to be the total taxable value of land and additions on the property. | Land | Improvement |
|---|---|---|---|---|
| 2024 | $6,720 | $91,147 | $20,107 | $71,040 |
| 2023 | $6,720 | $82,322 | $18,160 | $64,162 |
| 2022 | $5,109 | $73,936 | $16,310 | $57,626 |
| 2021 | $4,783 | $69,099 | $15,243 | $53,856 |
| 2020 | $4,697 | $67,139 | $14,811 | $52,328 |
| 2019 | $4,499 | $63,972 | $14,112 | $49,860 |
| 2018 | $4,257 | $60,105 | $13,259 | $46,846 |
| 2017 | $4,090 | $57,118 | $12,600 | $44,518 |
| 2016 | $3,771 | $52,454 | $12,017 | $40,437 |
| 2015 | $3,447 | $49,137 | $11,257 | $37,880 |
| 2014 | $3,447 | $47,403 | $10,860 | $36,543 |
| 2013 | $3,447 | $47,403 | $10,860 | $36,543 |
Source: Public Records
Map
Nearby Homes
- 16040 S Arbor Dr
- 0009 Illinois Route 59
- 0007 Illinois Route 59
- 0006 Illinois Route 59
- 0005 Illinois Route 59
- 0003 Illinois Route 59
- 15707 S Route 59
- 16165 S Arbor Dr
- 15824 S Collins Dr
- 15623 S Frederick Ave
- 23538 W Rueben St Unit 6
- 23545 W Rueben St
- 23516 W Matthews St
- 25747 Yorkshire Dr
- 16410 S Howard St
- 23924 W Dayfield Dr Unit 23B
- 23660 Dayfield Ct
- 16320 Spring Creek Ln
- 23314 W Leach Dr
- 16402 S Mcgrath Dr
- 15932 Fairfield Dr
- 15940 Fairfield Dr
- 15940 Fairfield Dr Unit 1594
- 15930 Fairfield Dr
- 15930 Fairfield Dr Unit 1593
- 15942 Fairfield Dr
- 15946 Fairfield Dr
- 15946 Fairfield Dr Unit A
- 23815 W Renwick Rd
- 15948 Fairfield Dr
- 15931 Fairfield Dr
- 15921 Fairfield Dr
- 15941 Fairfield Dr
- 15956 Fairfield Dr
- 15958 Fairfield Dr
- 15911 Fairfield Dr
- 15951 Fairfield Dr
- 000 Fredrick St
- 16000 Fairfield Dr
- 15961 Fairfield Dr