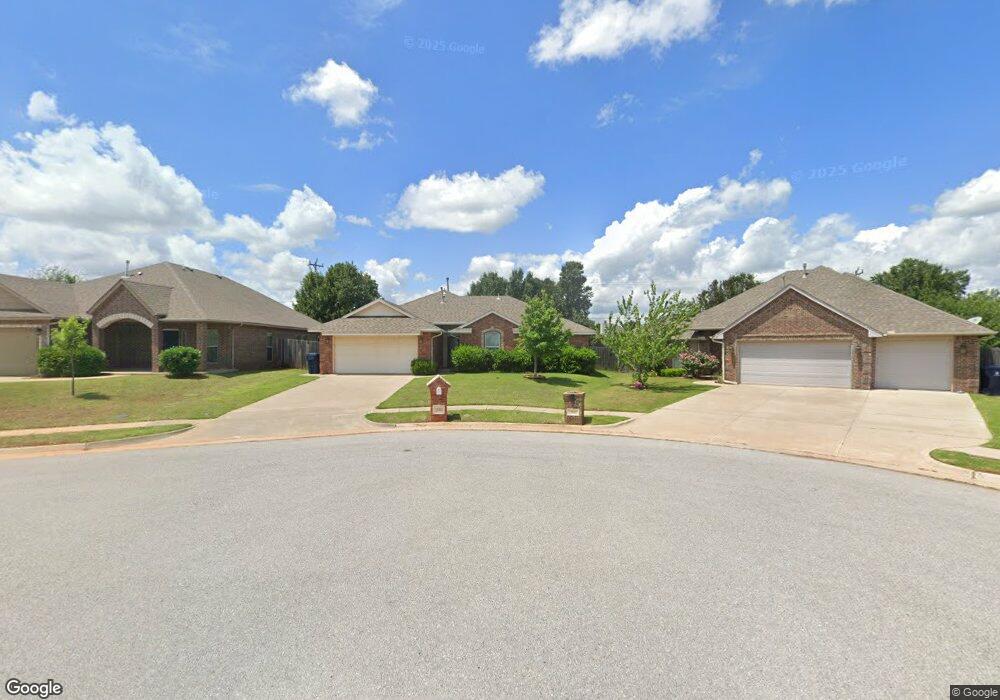
15933 Big Cypress Dr Edmond, OK 73013
Quail Springs NeighborhoodEstimated Value: $266,000 - $279,000
3
Beds
2
Baths
1,586
Sq Ft
$172/Sq Ft
Est. Value
About This Home
This home is located at 15933 Big Cypress Dr, Edmond, OK 73013 and is currently estimated at $272,386, approximately $171 per square foot. 15933 Big Cypress Dr is a home with nearby schools including Angie Debo Elementary School, Summit Middle School, and Santa Fe High School.
Ownership History
Date
Name
Owned For
Owner Type
Purchase Details
Closed on
Feb 17, 2021
Sold by
Mclemore Sue A Gibson and Mclemore David
Bought by
Mclemore David and Mclemore Sue
Current Estimated Value
Home Financials for this Owner
Home Financials are based on the most recent Mortgage that was taken out on this home.
Original Mortgage
$150,000
Outstanding Balance
$134,042
Interest Rate
2.65%
Mortgage Type
Credit Line Revolving
Estimated Equity
$138,344
Purchase Details
Closed on
Feb 24, 2011
Sold by
Two Structures L L C
Bought by
Gibson Sue A
Home Financials for this Owner
Home Financials are based on the most recent Mortgage that was taken out on this home.
Original Mortgage
$163,794
Interest Rate
4.7%
Mortgage Type
FHA
Purchase Details
Closed on
Oct 22, 2010
Sold by
Mcmd L L C
Bought by
Two Structures L L C
Home Financials for this Owner
Home Financials are based on the most recent Mortgage that was taken out on this home.
Original Mortgage
$131,200
Interest Rate
6.25%
Mortgage Type
Purchase Money Mortgage
Create a Home Valuation Report for This Property
The Home Valuation Report is an in-depth analysis detailing your home's value as well as a comparison with similar homes in the area
Home Values in the Area
Average Home Value in this Area
Purchase History
| Date | Buyer | Sale Price | Title Company |
|---|---|---|---|
| Mclemore David | -- | Accommodation | |
| Gibson Sue A | $166,000 | First American Title | |
| Two Structures L L C | $39,000 | First American Title |
Source: Public Records
Mortgage History
| Date | Status | Borrower | Loan Amount |
|---|---|---|---|
| Open | Mclemore David | $150,000 | |
| Closed | Gibson Sue A | $163,794 | |
| Previous Owner | Two Structures L L C | $131,200 |
Source: Public Records
Tax History Compared to Growth
Tax History
| Year | Tax Paid | Tax Assessment Tax Assessment Total Assessment is a certain percentage of the fair market value that is determined by local assessors to be the total taxable value of land and additions on the property. | Land | Improvement |
|---|---|---|---|---|
| 2024 | $2,463 | $22,345 | $3,703 | $18,642 |
| 2023 | $2,463 | $21,695 | $3,739 | $17,956 |
| 2022 | $2,410 | $21,063 | $4,144 | $16,919 |
| 2021 | $2,312 | $20,450 | $4,393 | $16,057 |
| 2020 | $2,275 | $19,855 | $4,305 | $15,550 |
| 2019 | $2,339 | $20,280 | $3,887 | $16,393 |
| 2018 | $2,281 | $19,690 | $0 | $0 |
| 2017 | $2,331 | $20,212 | $4,776 | $15,436 |
| 2016 | $2,247 | $19,624 | $4,793 | $14,831 |
| 2015 | $2,190 | $19,052 | $3,601 | $15,451 |
| 2014 | $2,117 | $18,497 | $3,679 | $14,818 |
Source: Public Records
Map
Nearby Homes
- 16124 Himalaya Ridge
- 2613 NW 159th St
- 2628 NW 159th St
- 2701 NW 160th St
- 2625 NW 161st St
- 2309 NW 157th Terrace
- 2313 NW 161st Terrace
- 15940 Katie Ridge Dr
- 2212 NW 158th St
- 16004 Katie Ridge Dr
- 2613 NW 162nd St
- 2801 NW 158th St
- 2300 NW 155th St
- 2729 NW 162nd St
- 2804 NW 158th St
- 16409 Osceola Trail
- 2416 NW 164th Terrace
- 2333 NW 153rd St
- 15517 Juniper Dr
- 16300 Seminole Pointe Place
- 15929 Big Cypress Dr
- 15937 Big Cypress Dr
- 19525 Big Cypress Dr
- 15925 Big Cypress Dr
- 16020 Himalaya Ridge
- 16016 Himalaya Ridge
- 2437 NW 159th Terrace
- 16024 Himalaya Ridge
- 15921 Big Cypress Dr
- 16012 Himalaya Ridge
- 2433 NW 159th Terrace
- 15924 Big Cypress Dr
- 16001 Big Cypress Dr
- 16028 Himalaya Ridge
- 2429 NW 159th Terrace
- 16008 Himalaya Ridge
- 16005 Big Cypress Dr
- 16000 Big Cypress Dr
- 15920 Big Cypress Dr
- 15916 Big Cypress Dr