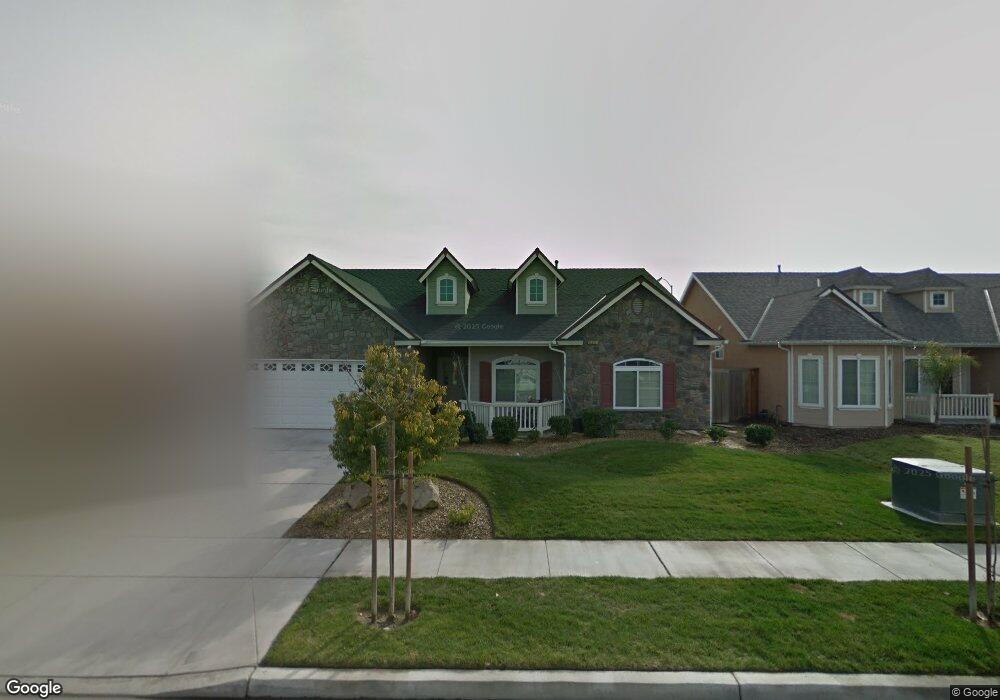
15933 W B St Kerman, CA 93630
Kerman AreaEstimated Value: $461,000 - $527,000
About This Home
This home is located at 15933 W B St, Kerman, CA 93630 and is currently estimated at $488,669, approximately $226 per square foot. 15933 W B St is a home located in Fresno County with nearby schools including Liberty Elementary School.
Ownership History
We collect this data history from publicly available records. To have your information removed, we recommend requesting removal directly through your county’s website.
Purchase Details
Purchase Details
Home Financials for this Owner
Home Financials are based on the most recent Mortgage that was taken out on this home.Purchase History
We collect this data history from publicly available records. To have your information removed, we recommend requesting removal directly through your county’s website.
| Date | Buyer | Sale Price | Title Company |
|---|---|---|---|
| -- | None Listed On Document | ||
| -- | None Listed On Document | ||
| $336,500 | North American Title Company |
Mortgage History
We collect this data history from publicly available records. To have your information removed, we recommend requesting removal directly through your county’s website.
| Date | Status | Borrower | Loan Amount |
|---|---|---|---|
| Previous Owner | $221,000 | ||
| Previous Owner | $238,800 | ||
| Previous Owner | $268,850 |
Tax History
We collect this data history from publicly available records. To have your information removed, we recommend requesting removal directly through your county’s website.
| Year | Tax Paid | Tax Assessment Tax Assessment Total Assessment is a certain percentage of the fair market value that is determined by local assessors to be the total taxable value of land and additions on the property. | Land | Improvement |
|---|---|---|---|---|
| 2025 | $5,341 | $455,306 | $100,476 | $354,830 |
| 2023 | $4,698 | $402,400 | $72,800 | $329,600 |
| 2022 | $4,564 | $387,000 | $70,000 | $317,000 |
| 2021 | $3,799 | $323,200 | $70,700 | $252,500 |
| 2020 | $3,760 | $320,000 | $70,000 | $250,000 |
| 2019 | $3,310 | $270,400 | $67,600 | $202,800 |
| 2018 | $3,168 | $265,200 | $66,300 | $198,900 |
| 2017 | $3,139 | $260,000 | $65,000 | $195,000 |
| 2016 | $2,552 | $226,000 | $65,000 | $161,000 |
| 2015 | $2,474 | $217,300 | $47,700 | $169,600 |
| 2014 | $2,465 | $217,300 | $47,700 | $169,600 |
Map
- 15906 W C St
- 386 S Susan Ave
- 16218 W Monterey Ave
- 16209 W Sunset Ave
- 16191 W Sunset Ave
- 16259 W David Ave
- 16269 W David Ave
- 16249 W David Ave
- 16161 W David Ave
- 16477 W Kearney Blvd
- 402 S Michelle Ave
- 505 S Del Norte Ave
- 15431 W E St
- 15888 W Stanislaus Ave
- 954 S 1st St
- 461 S Barcus Ave
- 414 S 4th St
- 14859 W Kearney Blvd
- 14853 W Middleton Ave
- 14621 W C St
Ask me questions while you tour the home.