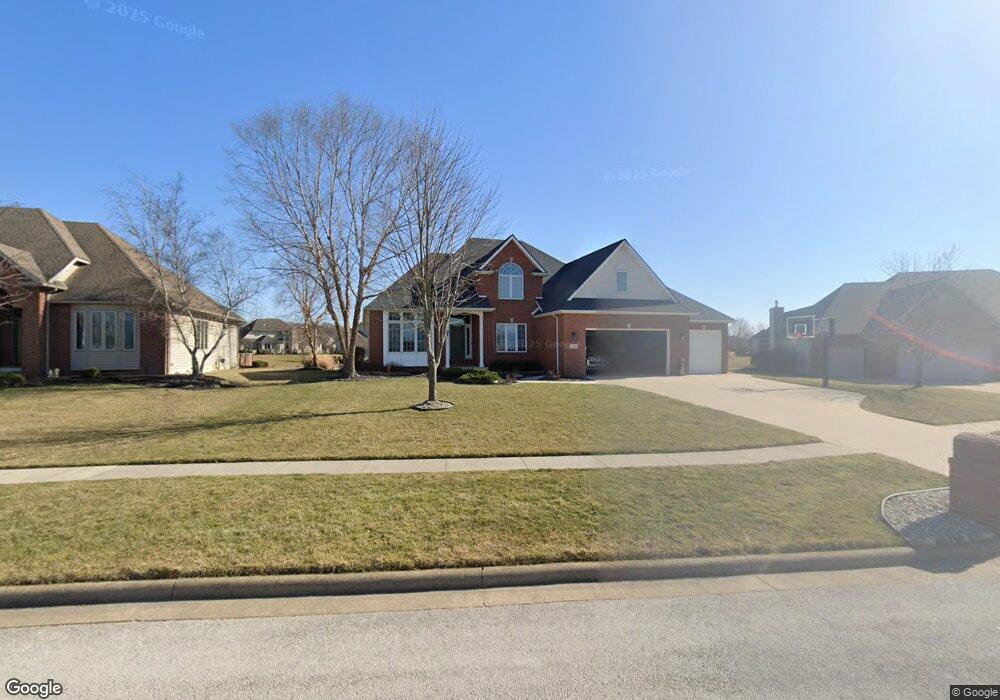
15939 Lakeside Ct Findlay, OH 45840
Estimated Value: $473,000 - $548,764
4
Beds
3
Baths
2,955
Sq Ft
$175/Sq Ft
Est. Value
About This Home
This home is located at 15939 Lakeside Ct, Findlay, OH 45840 and is currently estimated at $517,191, approximately $175 per square foot. 15939 Lakeside Ct is a home located in Hancock County with nearby schools including Wilson Vance Elementary School, Whittier Elementary School, and Glenwood Middle School.
Ownership History
Date
Name
Owned For
Owner Type
Purchase Details
Closed on
Dec 1, 2021
Sold by
Nunn Jeffrey G and Nunn Angela M
Bought by
Moser Gregory P and Moser Lauren A
Current Estimated Value
Home Financials for this Owner
Home Financials are based on the most recent Mortgage that was taken out on this home.
Original Mortgage
$327,920
Outstanding Balance
$299,240
Interest Rate
3.14%
Mortgage Type
New Conventional
Estimated Equity
$217,951
Purchase Details
Closed on
Jun 24, 2009
Sold by
Relocation Properties Management Llc
Bought by
Nunn Jeffrey G and Nunn Angela M
Home Financials for this Owner
Home Financials are based on the most recent Mortgage that was taken out on this home.
Original Mortgage
$265,000
Interest Rate
5.32%
Mortgage Type
Purchase Money Mortgage
Purchase Details
Closed on
Oct 20, 2008
Sold by
Puthoff Timothy D and Puthoff Diane M
Bought by
Relocation Properties Management Llc
Purchase Details
Closed on
Feb 10, 2004
Sold by
Jerry Niese Construction Co Llc
Bought by
Puthoff Timothy D and Puthoff Diane M
Home Financials for this Owner
Home Financials are based on the most recent Mortgage that was taken out on this home.
Original Mortgage
$272,400
Interest Rate
5.91%
Mortgage Type
Purchase Money Mortgage
Purchase Details
Closed on
Jan 23, 2003
Sold by
Swisher Douglas N
Bought by
Jerry Niese Constr Co Llc
Create a Home Valuation Report for This Property
The Home Valuation Report is an in-depth analysis detailing your home's value as well as a comparison with similar homes in the area
Purchase History
| Date | Buyer | Sale Price | Title Company |
|---|---|---|---|
| Moser Gregory P | $409,900 | Mid Am Title Agency | |
| Nunn Jeffrey G | $315,000 | Mid Am Title | |
| Relocation Properties Management Llc | $353,500 | Mid Am Title Agency | |
| Puthoff Timothy D | $340,500 | Abstract Title | |
| Jerry Niese Constr Co Llc | $49,900 | -- |
Source: Public Records
Mortgage History
| Date | Status | Borrower | Loan Amount |
|---|---|---|---|
| Open | Moser Gregory P | $327,920 | |
| Closed | Nunn Jeffrey G | $265,000 | |
| Previous Owner | Puthoff Timothy D | $272,400 |
Source: Public Records
Tax History
| Year | Tax Paid | Tax Assessment Tax Assessment Total Assessment is a certain percentage of the fair market value that is determined by local assessors to be the total taxable value of land and additions on the property. | Land | Improvement |
|---|---|---|---|---|
| 2024 | $5,673 | $159,150 | $21,870 | $137,280 |
| 2023 | $5,682 | $159,150 | $21,870 | $137,280 |
| 2022 | $5,662 | $159,150 | $21,870 | $137,280 |
| 2021 | $5,839 | $142,580 | $12,490 | $130,090 |
| 2020 | $5,838 | $142,580 | $12,490 | $130,090 |
| 2019 | $5,721 | $142,580 | $12,490 | $130,090 |
| 2018 | $5,190 | $118,400 | $9,990 | $108,410 |
| 2017 | $2,596 | $118,400 | $9,990 | $108,410 |
| 2016 | $5,091 | $118,400 | $9,990 | $108,410 |
| 2015 | $5,172 | $117,250 | $9,990 | $107,260 |
| 2014 | $4,976 | $115,410 | $9,990 | $105,420 |
| 2012 | $5,199 | $119,810 | $9,990 | $109,820 |
Source: Public Records
Map
Nearby Homes
- 8405 Indian Lake Dr
- 8464 Indian Lake Dr
- 8081 Ash Ridge Ln
- 15818 Forest Ln
- 8131 Brookfield Cir
- 8457 Lakewood Dr
- 0 Hickory Ln Unit 1
- 0 Hickory Ln Unit 1 307878
- 0 Hickory Ln Unit 20252999
- 7507 Township Road 212
- 0 E Us Route 224
- 15329 E Us Route 224
- 701 Red Fox Rd
- 456 Strathaven Dr
- 2533 Foxfire Ln
- 827 Abbey Ln
- 1121 Fox Run Rd
- 845 Fox Run Rd Unit 1
- 15739 Mallard Ln
- 821 Fox Run Rd Unit 6
- 15943 Lakeside Ct
- 15933 Lakeside Ct
- 15927 Lakeside Ct
- 8302 Shawnee Forest Dr
- 15944 Lakeside Ct
- 8318 Shawnee Forest Dr
- 8262 Shawnee Forest Dr
- 15940 Lakeside Ct
- 15930 Lakeside Ct
- 8545 Tawa Creek Dr
- 8380 Plumwood Dr
- 8531 Tawa Creek Dr
- 8559 Tawa Creek Dr
- 8332 Shawnee Forest Dr
- 8246 Shawnee Forest Dr
- 8519 Tawa Creek Dr
- 8386 Plumwood Dr
- 8507 Tawa Creek Dr
- 15943 Wolf Run
- 15939 Wolf Run
Your Personal Tour Guide
Ask me questions while you tour the home.