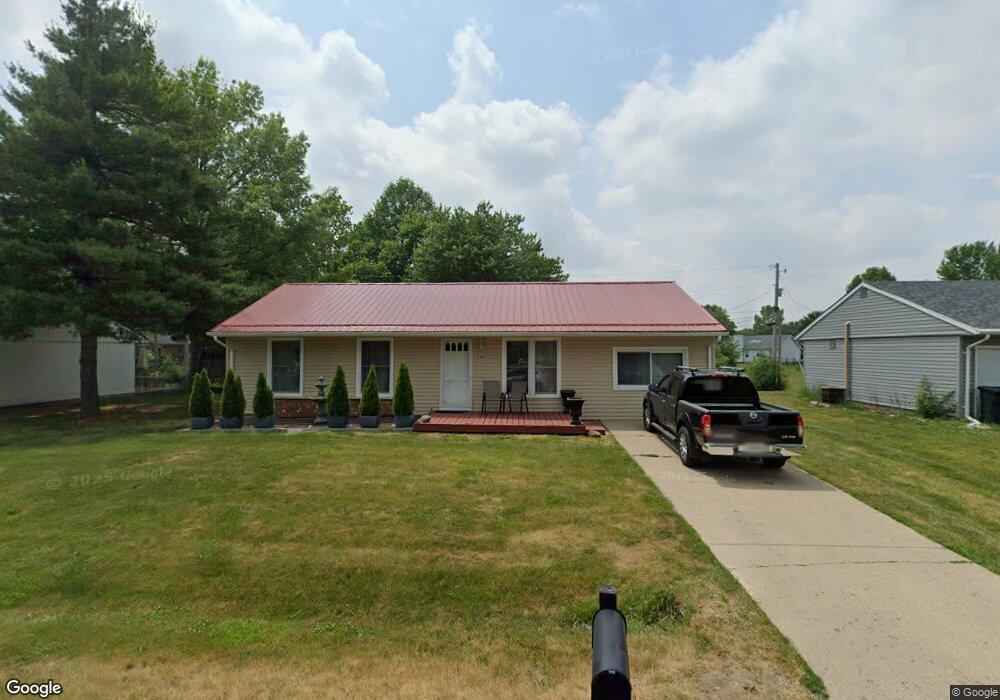
1594 Mason Dixon Dr E West Lafayette, IN 47906
Estimated Value: $222,011 - $258,000
3
Beds
1
Bath
1,248
Sq Ft
$194/Sq Ft
Est. Value
About This Home
Property Id: 992905
3 bed 1.5 bath single family home for rent in TSC school district. No smoking or pets allowed. Large eat in kitchen, living room, family room, and bonus room that could be used as a play room, office, or for storage. Rent includes Triton reverse osmosis drinking water system, water softener, and 30 bags of softener salt (approx. 1yr supply). Home has been spruced up with luxury vinyl plank throughout, a fresh coat of paint, new kitchen cabinets & counters, etc. Currently available for a one year lease. Backyard firepit and shed included.
Ownership History
Date
Name
Owned For
Owner Type
Purchase Details
Closed on
Apr 18, 2020
Sold by
Johns Jeffrey C and Johns Jane M
Bought by
Johns Rex L and Johns Diana J
Current Estimated Value
Purchase Details
Closed on
Apr 9, 2013
Sold by
Krick Karry T
Bought by
Johns Jeffery C and Johns Jane M
Home Financials for this Owner
Home Financials are based on the most recent Mortgage that was taken out on this home.
Original Mortgage
$74,700
Outstanding Balance
$52,800
Interest Rate
3.5%
Mortgage Type
Purchase Money Mortgage
Estimated Equity
$188,953
Create a Home Valuation Report for This Property
The Home Valuation Report is an in-depth analysis detailing your home's value as well as a comparison with similar homes in the area
Home Values in the Area
Average Home Value in this Area
Purchase History
| Date | Buyer | Sale Price | Title Company |
|---|---|---|---|
| Johns Rex L | $90,000 | Bennett Boehning & Clary | |
| Johns Jeffery C | -- | -- |
Source: Public Records
Mortgage History
| Date | Status | Borrower | Loan Amount |
|---|---|---|---|
| Open | Johns Jeffery C | $74,700 |
Source: Public Records
Property History
| Date | Event | Price | List to Sale | Price per Sq Ft |
|---|---|---|---|---|
| 08/23/2025 08/23/25 | Off Market | $1,665 | -- | -- |
| 07/13/2025 07/13/25 | For Rent | $1,665 | 0.0% | -- |
| 05/29/2025 05/29/25 | Off Market | $1,665 | -- | -- |
| 04/24/2025 04/24/25 | For Rent | $1,665 | -- | -- |
Tax History Compared to Growth
Tax History
| Year | Tax Paid | Tax Assessment Tax Assessment Total Assessment is a certain percentage of the fair market value that is determined by local assessors to be the total taxable value of land and additions on the property. | Land | Improvement |
|---|---|---|---|---|
| 2024 | $2,462 | $159,800 | $19,500 | $140,300 |
| 2023 | $1,882 | $121,200 | $19,500 | $101,700 |
| 2022 | $1,712 | $110,200 | $19,500 | $90,700 |
| 2021 | $1,442 | $95,800 | $19,500 | $76,300 |
| 2020 | $1,389 | $88,700 | $19,500 | $69,200 |
| 2019 | $1,300 | $85,100 | $19,500 | $65,600 |
| 2018 | $1,232 | $82,200 | $16,500 | $65,700 |
| 2017 | $1,208 | $81,800 | $16,500 | $65,300 |
| 2016 | $1,196 | $81,300 | $16,500 | $64,800 |
| 2014 | $1,086 | $75,000 | $16,500 | $58,500 |
| 2013 | $222 | $74,400 | $16,500 | $57,900 |
Source: Public Records
Map
Nearby Homes
- 34 Lee Ct
- 1512 Shining Armor Ln
- 4321 Mcclellan Ln
- 1500 Roundtable Dr
- 1632 Solemar Dr
- 1467 Solemar Dr
- 1408 Solemar Dr
- 4440 N Candlewick Ln
- 1380 Solemar Dr
- 4446 Crossbow Ct
- 1050 Edgerton St
- 4880 N 225 W
- 1044 Roxboro St
- 2330 Centennial Ct W
- 3156 Stratus Dr
- 3519 Senior Place
- 3437 Covington St
- 4948 Taft Rd
- 242 W Big Pine Dr
- 4801 Homewood Dr
- 1590 Mason Dixon Dr E
- 1598 Mason Dixon Dr E
- 52 Trooper Ct
- 62 Trooper Ct
- 4320 Mason Dixon Dr
- 4320 E Mason Dixon Dr
- 1602 Mason Dixon Dr S
- 1593 Mason Dixon Dr E
- 1589 Mason Dixon Dr E
- 4324 Mason Dixon Dr
- 42 Trooper Ct
- 1597 Mason Dixon Dr E
- 4321 Mason Dixon Dr
- 1599 Mason Dixon Dr E
- 4325 Mason Dixon Dr
- 1501 Shining Armor Ln
- 4319 Roundtable Ct
- 32 Trooper Ct
- 1505 Shining Armor Ln
- 340 Vicksburg Ln