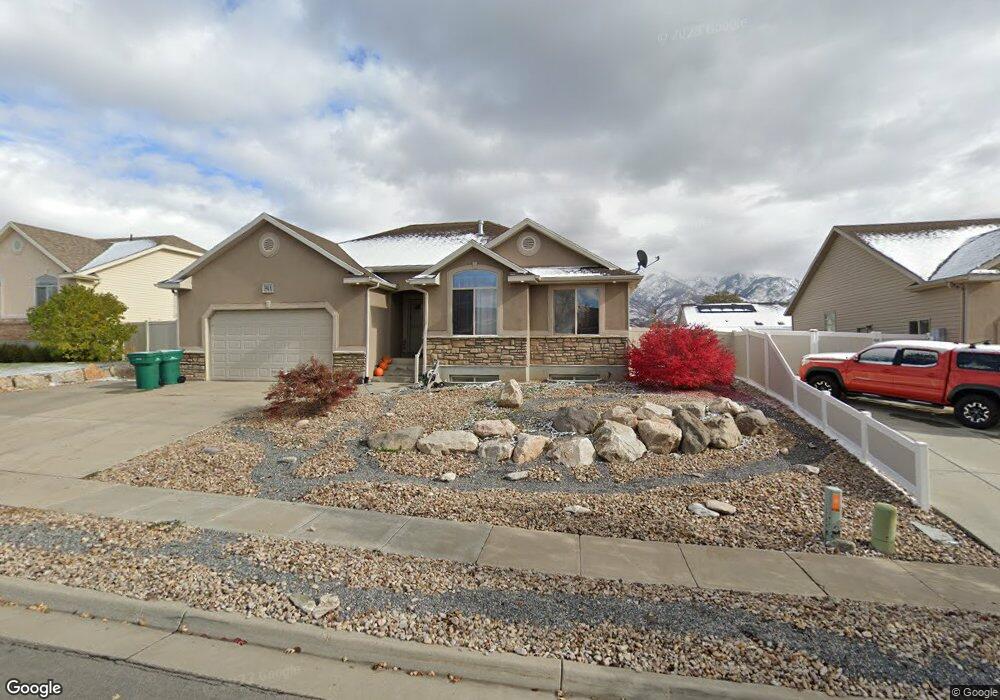
1594 N 200 E Layton, UT 84041
Estimated Value: $565,000 - $602,000
5
Beds
3
Baths
3,280
Sq Ft
$178/Sq Ft
Est. Value
About This Home
This home is located at 1594 N 200 E, Layton, UT 84041 and is currently estimated at $585,284, approximately $178 per square foot. 1594 N 200 E is a home located in Davis County with nearby schools including Lincoln Elementary School, North Layton Junior High School, and Northridge High School.
Ownership History
Date
Name
Owned For
Owner Type
Purchase Details
Closed on
Aug 1, 2012
Sold by
Zolnik Sebastian and Zolnik Stephanie A
Bought by
Zolnik Stephanie A
Current Estimated Value
Home Financials for this Owner
Home Financials are based on the most recent Mortgage that was taken out on this home.
Original Mortgage
$241,575
Outstanding Balance
$165,408
Interest Rate
3.5%
Mortgage Type
New Conventional
Estimated Equity
$419,876
Purchase Details
Closed on
Jun 27, 2006
Sold by
Perry Homes Inc
Bought by
Zolnik Sebastian and Zolnik Stephanie A
Home Financials for this Owner
Home Financials are based on the most recent Mortgage that was taken out on this home.
Original Mortgage
$48,675
Interest Rate
6.66%
Mortgage Type
Purchase Money Mortgage
Create a Home Valuation Report for This Property
The Home Valuation Report is an in-depth analysis detailing your home's value as well as a comparison with similar homes in the area
Home Values in the Area
Average Home Value in this Area
Purchase History
| Date | Buyer | Sale Price | Title Company |
|---|---|---|---|
| Zolnik Stephanie A | -- | None Available | |
| Zolnik Sebastian | -- | First American Title | |
| Perry Homes Inc | -- | First American Title |
Source: Public Records
Mortgage History
| Date | Status | Borrower | Loan Amount |
|---|---|---|---|
| Open | Zolnik Stephanie A | $241,575 | |
| Closed | Perry Homes Inc | $48,675 | |
| Closed | Zolnik Sebastian | $194,675 |
Source: Public Records
Tax History
| Year | Tax Paid | Tax Assessment Tax Assessment Total Assessment is a certain percentage of the fair market value that is determined by local assessors to be the total taxable value of land and additions on the property. | Land | Improvement |
|---|---|---|---|---|
| 2025 | $2,824 | $296,450 | $101,220 | $195,230 |
| 2024 | $2,700 | $285,450 | $117,989 | $167,461 |
| 2023 | $2,699 | $503,000 | $140,713 | $362,287 |
| 2022 | $2,815 | $284,900 | $74,266 | $210,634 |
| 2021 | $2,597 | $392,000 | $103,826 | $288,174 |
| 2020 | $2,362 | $342,000 | $87,509 | $254,491 |
| 2019 | $2,334 | $331,000 | $83,247 | $247,753 |
| 2018 | $2,121 | $302,000 | $83,247 | $218,753 |
| 2016 | $1,974 | $144,980 | $26,501 | $118,479 |
| 2015 | $2,006 | $139,865 | $26,501 | $113,364 |
| 2014 | $2,040 | $145,462 | $26,501 | $118,961 |
| 2013 | -- | $127,170 | $33,088 | $94,082 |
Source: Public Records
Map
Nearby Homes
Your Personal Tour Guide
Ask me questions while you tour the home.