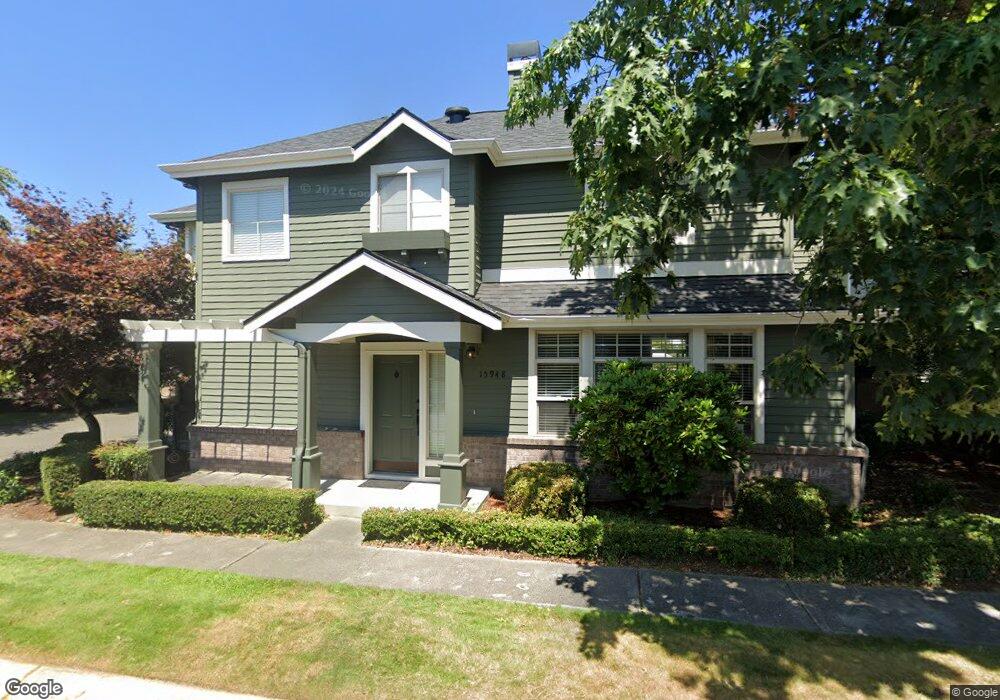
15940 NE 95th Way Unit 18 Redmond, WA 98052
Downtown Redmond NeighborhoodEstimated Value: $1,049,259 - $1,116,000
2
Beds
3
Baths
1,677
Sq Ft
$644/Sq Ft
Est. Value
About This Home
This home is located at 15940 NE 95th Way Unit 18, Redmond, WA 98052 and is currently estimated at $1,079,815, approximately $643 per square foot. 15940 NE 95th Way Unit 18 is a home located in King County with nearby schools including Rockwell Elementary, Redmond Middle School, and Redmond High School.
Ownership History
Date
Name
Owned For
Owner Type
Purchase Details
Closed on
Aug 27, 2013
Sold by
Lukasik Christine L
Bought by
Calargun Seda Unal and Calargun Canku Alp
Current Estimated Value
Home Financials for this Owner
Home Financials are based on the most recent Mortgage that was taken out on this home.
Original Mortgage
$367,200
Outstanding Balance
$93,602
Interest Rate
4.33%
Estimated Equity
$986,213
Purchase Details
Closed on
Mar 19, 2010
Sold by
Huang Mengqi C and Huang Zhenfen
Bought by
Lukasik Christine L
Home Financials for this Owner
Home Financials are based on the most recent Mortgage that was taken out on this home.
Original Mortgage
$352,000
Interest Rate
4.12%
Purchase Details
Closed on
Dec 19, 2009
Sold by
Huang Mengqi C and Huang Zhenfen
Bought by
Huang Mengqi C and Huang Zhenfen
Home Financials for this Owner
Home Financials are based on the most recent Mortgage that was taken out on this home.
Original Mortgage
$283,882
Interest Rate
5%
Create a Home Valuation Report for This Property
The Home Valuation Report is an in-depth analysis detailing your home's value as well as a comparison with similar homes in the area
Home Values in the Area
Average Home Value in this Area
Purchase History
| Date | Buyer | Sale Price | Title Company |
|---|---|---|---|
| Calargun Seda Unal | $459,000 | First American | |
| Lukasik Christine L | $440,000 | Rainier Title | |
| Huang Mengqi C | -- | First American |
Source: Public Records
Mortgage History
| Date | Status | Borrower | Loan Amount |
|---|---|---|---|
| Open | Calargun Seda Unal | $367,200 | |
| Previous Owner | Lukasik Christine L | $352,000 | |
| Previous Owner | Huang Mengqi C | $283,882 |
Source: Public Records
Tax History Compared to Growth
Tax History
| Year | Tax Paid | Tax Assessment Tax Assessment Total Assessment is a certain percentage of the fair market value that is determined by local assessors to be the total taxable value of land and additions on the property. | Land | Improvement |
|---|---|---|---|---|
| 2024 | $8,187 | $1,041,000 | $151,200 | $889,800 |
| 2023 | $6,324 | $1,031,000 | $151,200 | $879,800 |
| 2022 | $6,568 | $859,000 | $134,400 | $724,600 |
| 2021 | $6,473 | $763,000 | $134,400 | $628,600 |
| 2020 | $6,598 | $695,000 | $134,400 | $560,600 |
| 2018 | $5,917 | $695,000 | $105,000 | $590,000 |
| 2017 | $4,914 | $592,000 | $75,600 | $516,400 |
| 2016 | $4,516 | $513,000 | $75,600 | $437,400 |
| 2015 | $4,539 | $467,000 | $75,600 | $391,400 |
| 2014 | -- | $453,000 | $65,800 | $387,200 |
| 2013 | -- | $358,000 | $57,100 | $300,900 |
Source: Public Records
Map
Nearby Homes
- 9484 Redmond-Woodinville Rd NE Unit C-305
- 9484 Redmond-Woodinville Rd NE Unit C-205
- 9625 164th Ave NE
- 8850 Redmond Woodinville Rd NE Unit 305-
- 10176 156th Ct NE Unit 102
- 10260 157th Place NE Unit 101
- 8835 166th Ave NE Unit D102
- 15415 NE 103rd Way
- 8652 164th Ave NE Unit C109
- 16275 NE 85th St Unit 107
- 16413 NE 105th Place
- 17020 NE 93rd Ct
- 8117 166th Ave NE
- 16141 Cleveland St Unit 401
- 16141 Cleveland St Unit 417
- 16141 Cleveland St Unit 317
- 7579 Old Redmond Rd Unit 14
- 8217 145th Ct NE Unit C11
- 7583 Old Redmond Rd Unit A203
- 7435 Old Redmond Rd Unit 325
- 15940 NE 95th Way
- 15948 NE 95th Way Unit 17
- 15948 NE 95th Way
- 15932 NE 95th Way Unit 19
- 15924 NE 95th Way
- 15908 NE 95th Way Unit 22
- 15908 NE 95th Way
- 15854 NE 95th Way
- 15916 NE 95th Way
- 15915 NE 95th Way
- 15907 NE 95th Way
- 15972 NE 95th Way Unit 3
- 15972 NE 95th Way
- 15886 NE 95th Way Unit 25
- 15886 NE 95th Way
- 15939 NE 95th Way
- 15987 NE 95th Way
- 15980 NE 95th Way
- 15980 NE 95th Way Unit 2
- 15883 NE 95th Way