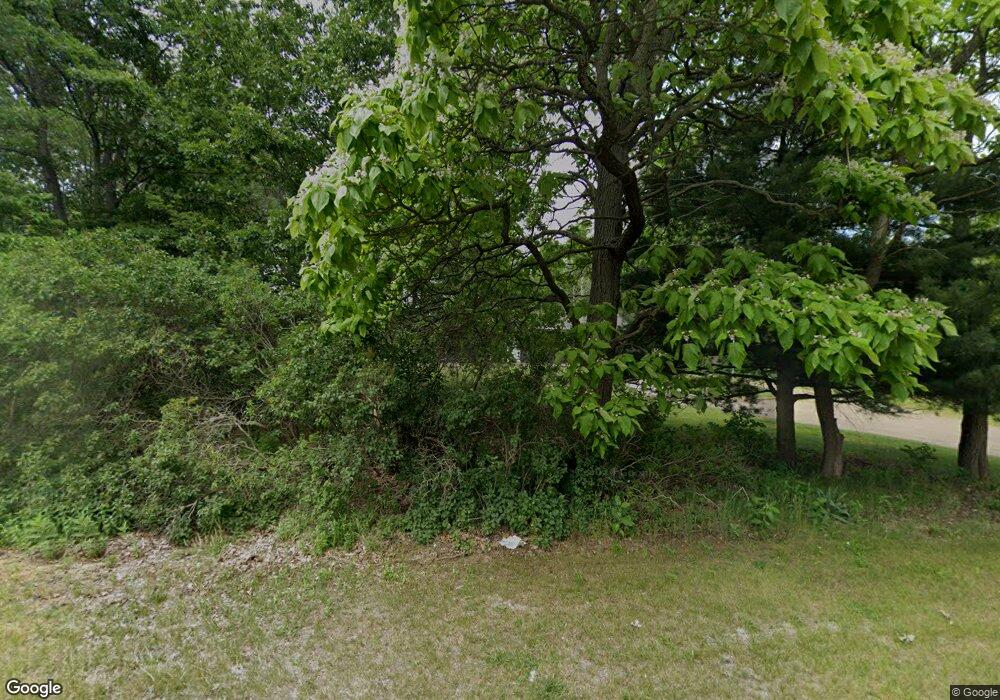
15945 Fillmore St West Olive, MI 49460
Estimated Value: $384,000
--
Bed
2
Baths
1,580
Sq Ft
$243/Sq Ft
Est. Value
About This Home
This home is located at 15945 Fillmore St, West Olive, MI 49460 and is currently priced at $384,000, approximately $243 per square foot. 15945 Fillmore St is a home located in Ottawa County with nearby schools including Rosy Mound School, Central High School, and Lakeshore Middle School.
Ownership History
Date
Name
Owned For
Owner Type
Purchase Details
Closed on
Mar 18, 2022
Sold by
Bethig Merritt L
Bought by
Haak Brendan Charles and Haak Kailey
Current Estimated Value
Home Financials for this Owner
Home Financials are based on the most recent Mortgage that was taken out on this home.
Original Mortgage
$201,400
Outstanding Balance
$188,674
Interest Rate
4.16%
Mortgage Type
New Conventional
Purchase Details
Closed on
May 10, 2021
Sold by
Haak Brendan Charles
Bought by
Yeager Brent C and Yeager Amy L
Purchase Details
Closed on
Nov 12, 2020
Sold by
Bethig Merritt
Bought by
Haak Brendan Charles
Home Financials for this Owner
Home Financials are based on the most recent Mortgage that was taken out on this home.
Original Mortgage
$290,000
Interest Rate
2.8%
Mortgage Type
Land Contract Argmt. Of Sale
Create a Home Valuation Report for This Property
The Home Valuation Report is an in-depth analysis detailing your home's value as well as a comparison with similar homes in the area
Home Values in the Area
Average Home Value in this Area
Purchase History
| Date | Buyer | Sale Price | Title Company |
|---|---|---|---|
| Haak Brendan Charles | $290,000 | None Listed On Document | |
| Yeager Brent C | $115,000 | Premier Lakeshore Ttl Agcy L | |
| Haak Brendan Charles | $86,250 | Premier Lakeshore Ttl Agcy L | |
| Haak Brendan Charles | $290,000 | None Available |
Source: Public Records
Mortgage History
| Date | Status | Borrower | Loan Amount |
|---|---|---|---|
| Open | Haak Brendan Charles | $201,400 | |
| Previous Owner | Haak Brendan Charles | $290,000 |
Source: Public Records
Tax History Compared to Growth
Tax History
| Year | Tax Paid | Tax Assessment Tax Assessment Total Assessment is a certain percentage of the fair market value that is determined by local assessors to be the total taxable value of land and additions on the property. | Land | Improvement |
|---|---|---|---|---|
| 2021 | $3,595 | $123,400 | $0 | $0 |
| 2020 | $3,990 | $118,100 | $0 | $0 |
| 2019 | $3,922 | $102,200 | $0 | $0 |
| 2018 | $3,722 | $99,400 | $55,000 | $44,400 |
| 2017 | $3,649 | $94,500 | $0 | $0 |
| 2016 | $3,640 | $90,100 | $0 | $0 |
| 2015 | -- | $89,800 | $0 | $0 |
| 2014 | -- | $89,200 | $0 | $0 |
Source: Public Records
Map
Nearby Homes
- 15899 Fillmore St
- 0 158th Ave
- 0 Desay Dr Unit 25035557
- 0 Desay Dr Unit 25035476
- 0 Desay Dr Unit 25035446
- 15955 Revello Ct
- 14984 Fillmore St Unit Lot 49
- 16964 Fillmore St
- 9439 Shoreway Dr
- 9381 Shoreway Dr
- 16735 Pierce St
- 9355 Windward Dr
- 9365 Windward Dr
- 15991 Croswell St
- 9135 Winterberry Dr
- 8894 Lakeshore Ave
- 14571 Bigleaf Dr
- 9410 Whispering Sands Dr
- 16759 Winans St
- 9150 Stoney Station Unit Lot 570
- 15925 Fillmore St
- 15946 Fillmore St
- 15974 Fillmore St
- 15912 Fillmore St
- 15886 Fillmore St
- 15870 Fillmore St
- 9623 160th Ave
- 9665 160th Ave
- 15832 Fillmore St
- 9573 160th Ave
- 15875 Fillmore St
- 15700 Fillmore St
- 16081 Fillmore St
- 16064 Fillmore St
- 9768 160th Ave
- 15618 Fillmore St
- 9745 160th Ave
- 9521 160th Ave
- 16111 Fillmore St
- 16596 Fillmore St
