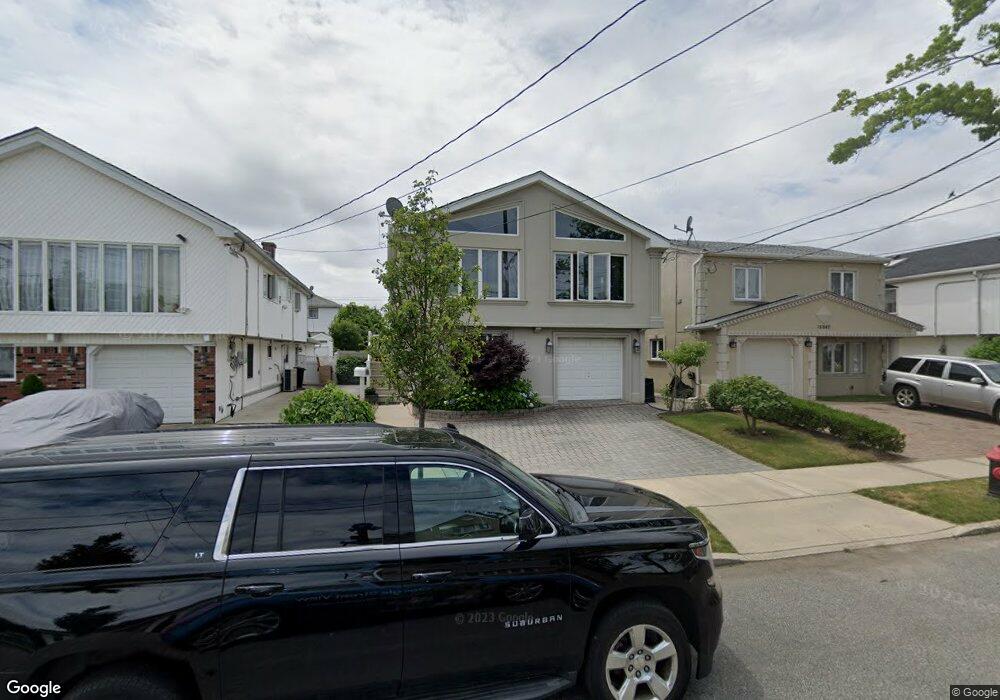
15946 86th St Howard Beach, NY 11414
Howard Beach NeighborhoodEstimated Value: $999,884 - $1,148,000
Studio
--
Bath
2,220
Sq Ft
$493/Sq Ft
Est. Value
About This Home
This home is located at 15946 86th St, Howard Beach, NY 11414 and is currently estimated at $1,094,221, approximately $492 per square foot. 15946 86th St is a home located in Queens County with nearby schools including P.S./M.S. 207 Rockwood Park, Robert H. Goddard High School, and John Adams High School.
Ownership History
Date
Name
Owned For
Owner Type
Purchase Details
Closed on
Nov 23, 2009
Sold by
Roselli Sarah F and Russo Anthony
Bought by
Roselli Sarah F
Current Estimated Value
Home Financials for this Owner
Home Financials are based on the most recent Mortgage that was taken out on this home.
Original Mortgage
$499,000
Outstanding Balance
$320,814
Interest Rate
4.78%
Mortgage Type
Purchase Money Mortgage
Estimated Equity
$773,407
Purchase Details
Closed on
Dec 7, 2006
Sold by
Sausa Maria G
Bought by
Roselli Sarah F and Russo Antonio
Home Financials for this Owner
Home Financials are based on the most recent Mortgage that was taken out on this home.
Original Mortgage
$499,000
Interest Rate
6.35%
Mortgage Type
Purchase Money Mortgage
Purchase Details
Closed on
Oct 8, 2002
Sold by
Bernstein Judah and Bernstein Phyllis
Bought by
Sausa Maria G
Create a Home Valuation Report for This Property
The Home Valuation Report is an in-depth analysis detailing your home's value as well as a comparison with similar homes in the area
Home Values in the Area
Average Home Value in this Area
Purchase History
| Date | Buyer | Sale Price | Title Company |
|---|---|---|---|
| Roselli Sarah F | -- | -- | |
| Roselli Sarah F | -- | -- | |
| Roselli Sarah F | $820,000 | -- | |
| Roselli Sarah F | $820,000 | -- | |
| Sausa Maria G | -- | -- | |
| Sausa Maria G | -- | -- |
Source: Public Records
Mortgage History
| Date | Status | Borrower | Loan Amount |
|---|---|---|---|
| Open | Roselli Sarah F | $499,000 | |
| Previous Owner | Roselli Sarah F | $499,000 |
Source: Public Records
Tax History
| Year | Tax Paid | Tax Assessment Tax Assessment Total Assessment is a certain percentage of the fair market value that is determined by local assessors to be the total taxable value of land and additions on the property. | Land | Improvement |
|---|---|---|---|---|
| 2025 | $9,996 | $49,766 | $8,509 | $41,257 |
| 2024 | $6,357 | $49,766 | $10,182 | $39,584 |
| 2023 | $9,920 | $49,391 | $8,577 | $40,814 |
| 2022 | $9,302 | $51,240 | $10,680 | $40,560 |
| 2021 | $9,251 | $53,520 | $10,680 | $42,840 |
| 2020 | $8,778 | $47,160 | $10,680 | $36,480 |
| 2019 | $8,676 | $49,140 | $10,680 | $38,460 |
| 2018 | $8,093 | $41,159 | $10,319 | $30,840 |
| 2017 | $7,616 | $38,830 | $8,597 | $30,233 |
| 2016 | $7,013 | $38,830 | $8,597 | $30,233 |
| 2015 | $4,782 | $34,560 | $11,880 | $22,680 |
| 2014 | $4,782 | $34,560 | $11,880 | $22,680 |
Source: Public Records
Map
Nearby Homes
- 15936 88th St
- 159-32 88th St
- 160-09 86th St
- 159-44 85th St
- 159-15 89th St
- 160-46 87th St
- 158-38 84th St
- 161-08 86th St
- 160-14 83rd St
- 15741 87th St
- 160-34 83rd St
- 15817 90th St
- 157-49 84th St
- 16103 83rd St
- 161-35 88th St Unit 3-G
- 15920 82nd St
- 161-24 84th St
- 15724 86th St
- 159-27 81st St
- 159-29 92nd St
Your Personal Tour Guide
Ask me questions while you tour the home.