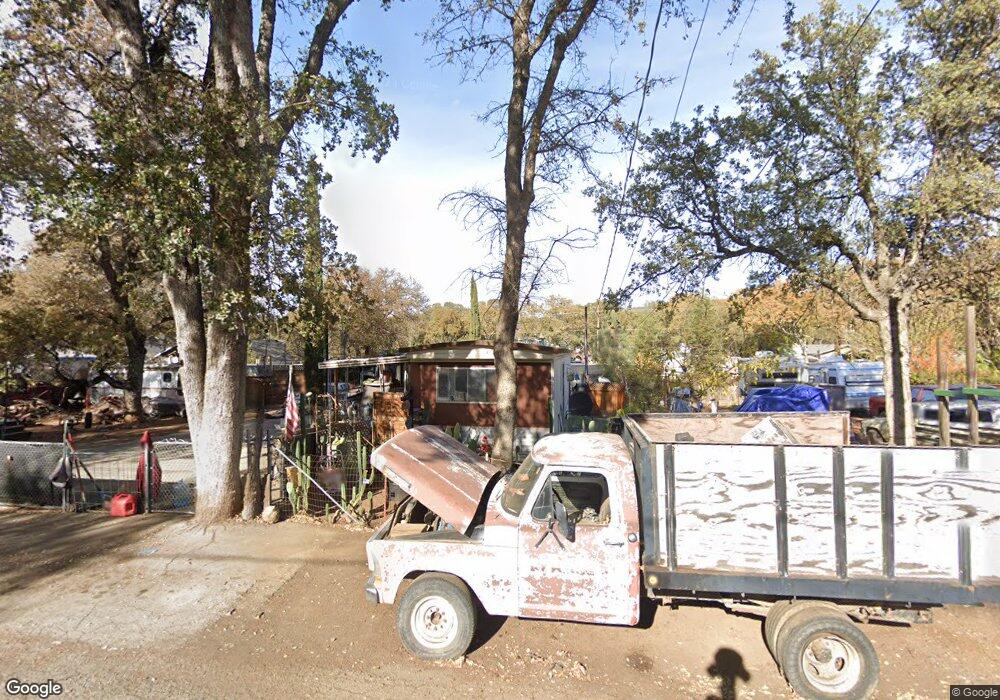
15948 35th Ave Clear Lake, CA 95422
Estimated Value: $104,000 - $145,524
2
Beds
2
Baths
--
Sq Ft
10,019
Sq Ft Lot Lot
About This Home
This home is located at 15948 35th Ave, Clear Lake, CA 95422 and is currently estimated at $125,175. 15948 35th Ave is a home located in Lake County with nearby schools including Lower Lake High School, Jeannies Learning Garden, and Clearlake Seventh-day Adventist Christian School.
Ownership History
Date
Name
Owned For
Owner Type
Purchase Details
Closed on
Jul 28, 2010
Sold by
Allred David E and Allred Maria Lourdes Ortega
Bought by
Giovannini Lisa
Current Estimated Value
Home Financials for this Owner
Home Financials are based on the most recent Mortgage that was taken out on this home.
Original Mortgage
$12,000
Outstanding Balance
$7,946
Interest Rate
4.65%
Mortgage Type
Seller Take Back
Estimated Equity
$117,229
Purchase Details
Closed on
Apr 22, 2009
Sold by
Allred David E
Bought by
Allred David E and Allred Maria Lourdes Ortega
Create a Home Valuation Report for This Property
The Home Valuation Report is an in-depth analysis detailing your home's value as well as a comparison with similar homes in the area
Purchase History
We collect this data history from publicly available records. To have your information removed, we recommend requesting removal directly through your county’s website.
| Date | Buyer | Sale Price | Title Company |
|---|---|---|---|
| Giovannini Lisa | $56,000 | Fidelity Natl Title Co Of Ca | |
| Allred David E | -- | None Available |
Source: Public Records
Mortgage History
We collect this data history from publicly available records. To have your information removed, we recommend requesting removal directly through your county’s website.
| Date | Status | Borrower | Loan Amount |
|---|---|---|---|
| Open | Giovannini Lisa | $12,000 |
Source: Public Records
Tax History
| Year | Tax Paid | Tax Assessment Tax Assessment Total Assessment is a certain percentage of the fair market value that is determined by local assessors to be the total taxable value of land and additions on the property. | Land | Improvement |
|---|---|---|---|---|
| 2025 | $778 | $89,669 | $30,743 | $58,926 |
| 2024 | $458 | $87,912 | $30,141 | $57,771 |
| 2023 | $753 | $86,189 | $29,550 | $56,639 |
| 2022 | $734 | $84,500 | $28,971 | $55,529 |
| 2021 | $708 | $82,844 | $28,403 | $54,441 |
| 2020 | $693 | $81,995 | $28,112 | $53,883 |
| 2019 | $1,096 | $80,388 | $27,561 | $52,827 |
| 2018 | $731 | $78,813 | $27,021 | $51,792 |
| 2017 | $1,437 | $77,269 | $26,492 | $50,777 |
| 2016 | $1,473 | $75,755 | $25,973 | $49,782 |
| 2015 | $1,453 | $74,618 | $25,583 | $49,035 |
| 2014 | $1,429 | $73,157 | $25,082 | $48,075 |
Source: Public Records
Map
Nearby Homes
- 16219 36th Ave
- 15608 36th Ave
- 16366 36th Ave
- 15894 35th Ave
- 15976 33rd Ave
- 15608 37th Ave
- 15615 37th Ave
- 15583 33rd Ave
- 15940 32nd Ave
- 15773 39th Ave
- 16258 35th Ave
- 15604 35th Ave
- 3631 Eureka Ave
- 15614 31st Ave
- 15786 33rd Ave
- 16064 31st Ave
- 15776 33rd Ave
- 15903 40th Ave
- 16053 31st Ave
- 16267 30th Ave
Your Personal Tour Guide
Ask me questions while you tour the home.