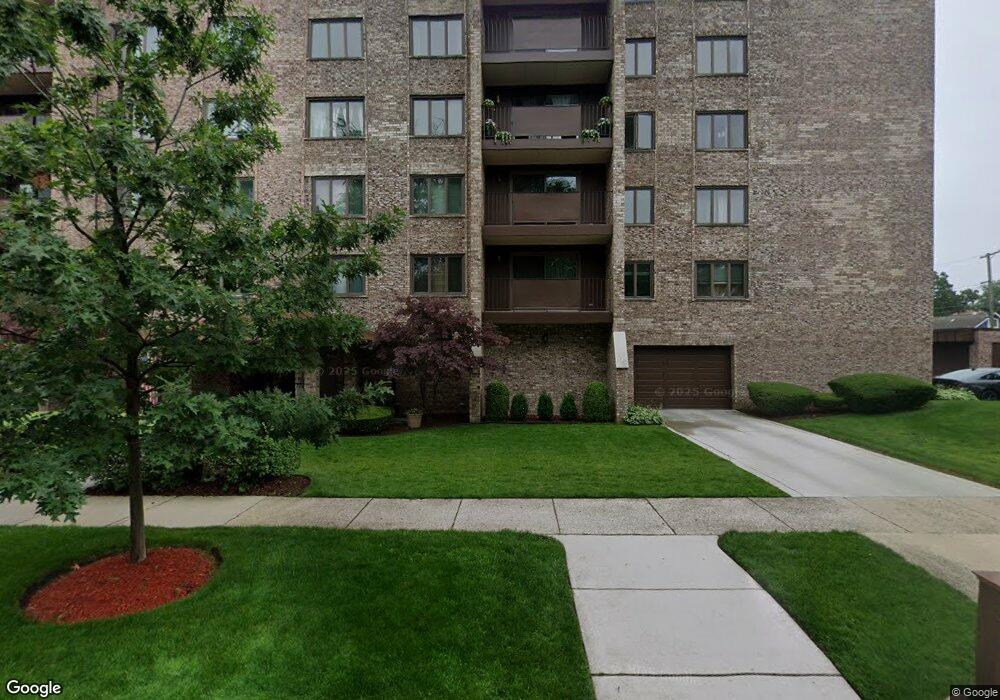
1595 Ashland Ave Unit 303 Des Plaines, IL 60016
Estimated Value: $226,591 - $270,000
2
Beds
--
Bath
72,600
Sq Ft
$3/Sq Ft
Est. Value
About This Home
This home is located at 1595 Ashland Ave Unit 303, Des Plaines, IL 60016 and is currently estimated at $253,148, approximately $3 per square foot. 1595 Ashland Ave Unit 303 is a home located in Cook County with nearby schools including Central Elementary School, Chippewa Middle School, and Maine West High School.
Ownership History
Date
Name
Owned For
Owner Type
Purchase Details
Closed on
Jun 19, 2002
Sold by
Thoma Carol
Bought by
Barger Yvonne C
Current Estimated Value
Home Financials for this Owner
Home Financials are based on the most recent Mortgage that was taken out on this home.
Original Mortgage
$148,500
Outstanding Balance
$58,063
Interest Rate
5.75%
Mortgage Type
Stand Alone First
Estimated Equity
$195,085
Create a Home Valuation Report for This Property
The Home Valuation Report is an in-depth analysis detailing your home's value as well as a comparison with similar homes in the area
Home Values in the Area
Average Home Value in this Area
Purchase History
| Date | Buyer | Sale Price | Title Company |
|---|---|---|---|
| Barger Yvonne C | $165,000 | -- |
Source: Public Records
Mortgage History
| Date | Status | Borrower | Loan Amount |
|---|---|---|---|
| Open | Barger Yvonne C | $148,500 |
Source: Public Records
Tax History Compared to Growth
Tax History
| Year | Tax Paid | Tax Assessment Tax Assessment Total Assessment is a certain percentage of the fair market value that is determined by local assessors to be the total taxable value of land and additions on the property. | Land | Improvement |
|---|---|---|---|---|
| 2024 | $3,347 | $16,012 | $657 | $15,355 |
| 2023 | $3,240 | $16,012 | $657 | $15,355 |
| 2022 | $3,240 | $16,012 | $657 | $15,355 |
| 2021 | $3,164 | $13,623 | $533 | $13,090 |
| 2020 | $3,179 | $13,623 | $533 | $13,090 |
| 2019 | $3,166 | $15,192 | $533 | $14,659 |
| 2018 | $2,376 | $11,380 | $471 | $10,909 |
| 2017 | $2,352 | $11,380 | $471 | $10,909 |
| 2016 | $2,468 | $11,380 | $471 | $10,909 |
| 2015 | $1,637 | $8,038 | $410 | $7,628 |
| 2014 | $1,619 | $8,038 | $410 | $7,628 |
| 2013 | $1,561 | $8,038 | $410 | $7,628 |
Source: Public Records
Map
Nearby Homes
- 1524 Oakwood Ave
- 1491 Ashland Ave Unit 3NW
- 1600 E Thacker St Unit 706
- 960 S River Rd Unit 208
- 835 Pearson St Unit 310
- 905 Center St Unit B507
- 750 Pearson St Unit 904
- 750 Pearson St Unit 204
- 1380 Oakwood Ave Unit 306
- 1365 Ashland Ave Unit 302
- 843 Lexington Cir E
- 711 S River Rd Unit 401
- 650 S River Rd Unit 306
- 1675 Mill St Unit 302
- 675 Pearson St Unit 710
- 1685 Mill St Unit 605
- 900 Lee St Unit 207
- 799 Graceland Ave Unit 504A
- 1488 Van Buren Ave
- 1486 Van Buren Ave
- 1595 Ashland Ave Unit 401
- 1595 Ashland Ave Unit 504
- 1595 Ashland Ave Unit G12
- 1595 Ashland Ave Unit 107
- 1595 Ashland Ave Unit G23
- 1595 Ashland Ave Unit 506
- 1595 Ashland Ave Unit G32
- 1595 Ashland Ave Unit G14
- 1595 Ashland Ave Unit G39
- 1595 Ashland Ave Unit G13
- 1595 Ashland Ave Unit G35
- 1595 Ashland Ave Unit G1
- 1595 Ashland Ave Unit G17
- 1595 Ashland Ave Unit 302
- 1595 Ashland Ave Unit G31
- 1595 Ashland Ave Unit 508
- 1595 Ashland Ave Unit G38
- 1595 Ashland Ave Unit G37
- 1595 Ashland Ave Unit 403
- 1595 Ashland Ave Unit G29