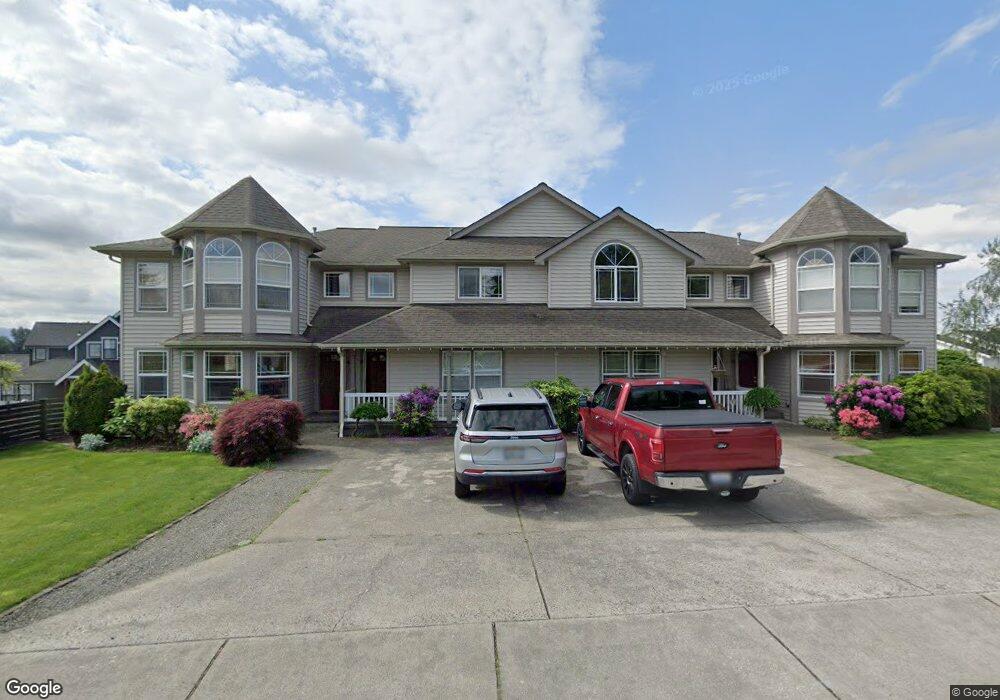
1595 Kok Rd Unit D Lynden, WA 98264
Estimated Value: $515,000 - $580,922
2
Beds
3
Baths
2,242
Sq Ft
$250/Sq Ft
Est. Value
About This Home
This home is located at 1595 Kok Rd Unit D, Lynden, WA 98264 and is currently estimated at $559,481, approximately $249 per square foot. 1595 Kok Rd Unit D is a home located in Whatcom County with nearby schools including Lynden High School, Lynden Christian School, and Lynden Christian Schools: Administration.
Ownership History
Date
Name
Owned For
Owner Type
Purchase Details
Closed on
Apr 27, 2021
Sold by
Zima Rachel S
Bought by
Whalen Steven R and Whalen Sheila S
Current Estimated Value
Home Financials for this Owner
Home Financials are based on the most recent Mortgage that was taken out on this home.
Original Mortgage
$170,000
Outstanding Balance
$153,822
Interest Rate
3%
Mortgage Type
New Conventional
Estimated Equity
$405,659
Purchase Details
Closed on
Sep 18, 2017
Sold by
Oettel Eric and Oettel Susan
Bought by
Zima Blake Jeffrey
Home Financials for this Owner
Home Financials are based on the most recent Mortgage that was taken out on this home.
Original Mortgage
$300,000
Interest Rate
3.93%
Mortgage Type
Purchase Money Mortgage
Purchase Details
Closed on
Apr 26, 2016
Sold by
Deboer Ronald J and De Boer Beverly K
Bought by
Zima Rachel S
Home Financials for this Owner
Home Financials are based on the most recent Mortgage that was taken out on this home.
Original Mortgage
$150,000
Interest Rate
3.71%
Mortgage Type
New Conventional
Purchase Details
Closed on
Feb 9, 2000
Sold by
Vanhofwegen John and Vanhofwegen Jessie
Bought by
Deboer Ronald J and Deboer Beverly K
Create a Home Valuation Report for This Property
The Home Valuation Report is an in-depth analysis detailing your home's value as well as a comparison with similar homes in the area
Home Values in the Area
Average Home Value in this Area
Purchase History
| Date | Buyer | Sale Price | Title Company |
|---|---|---|---|
| Whalen Steven R | $420,000 | Whatcom Land Title Co Inc | |
| Zima Blake Jeffrey | $83,000 | Whatcom Land Title Co Inc | |
| Zima Rachel S | $265,000 | First American Title Ins Co | |
| Deboer Ronald J | -- | Whatcom Land Title |
Source: Public Records
Mortgage History
| Date | Status | Borrower | Loan Amount |
|---|---|---|---|
| Open | Whalen Steven R | $170,000 | |
| Previous Owner | Zima Blake Jeffrey | $300,000 | |
| Previous Owner | Zima Rachel S | $150,000 |
Source: Public Records
Tax History Compared to Growth
Tax History
| Year | Tax Paid | Tax Assessment Tax Assessment Total Assessment is a certain percentage of the fair market value that is determined by local assessors to be the total taxable value of land and additions on the property. | Land | Improvement |
|---|---|---|---|---|
| 2024 | $3,443 | $478,560 | $75,000 | $403,560 |
| 2023 | $3,443 | $478,560 | $75,000 | $403,560 |
| 2022 | $3,324 | $407,114 | $86,620 | $320,494 |
| 2021 | $3,319 | $360,279 | $76,655 | $283,624 |
| 2020 | $3,005 | $327,520 | $69,685 | $257,835 |
| 2019 | $2,666 | $310,435 | $66,050 | $244,385 |
| 2018 | $2,795 | $282,235 | $60,050 | $222,185 |
| 2017 | $2,234 | $242,990 | $51,700 | $191,290 |
| 2016 | $2,169 | $206,495 | $45,645 | $160,850 |
| 2015 | $1,849 | $199,467 | $43,860 | $155,607 |
| 2014 | -- | $185,272 | $40,758 | $144,514 |
| 2013 | -- | $183,217 | $40,375 | $142,842 |
Source: Public Records
Map
Nearby Homes
- 314 S 16th St
- 1710 Farmview Terrace
- 2016 Steelhead Way
- 1774 Farmview Terrace
- 1717 E St
- 1510 E St
- 210 Stremler Dr
- 1218 Front St
- 106 Fairside Dr Unit D
- 403 17th St
- 915 Front St
- 0 Guide Meridian Unit NWM2369980
- 1882 Front St Unit B208
- 1882 Front St Unit B111
- 908 Liberty St
- 706 Judson St Unit B
- 706 Judson St Unit A
- 410 10th St
- 515 17th St
- 801 19th St
- 1595 Kok Rd Unit C
- 1595 Kok Rd Unit B
- 1595 Kok Rd Unit A
- 1595 Kok Rd
- 1594 Farmview Trace
- 0 Kok Rd
- 1586 Farmview Trace
- 1601 Kok Rd
- 1578 Farmview Trace
- 1602 Farmview Trace
- 1511 C St
- 1610 Farmview Trace
- 1570 Farmview Terrace
- 1570 Farmview Trace
- 1610 Kok Rd
- 1609 Kok Rd
- 1606 Kok Rd
- 1562 Farmview Trace
- 1619 Kok Rd
- 1595 Farmview Trace