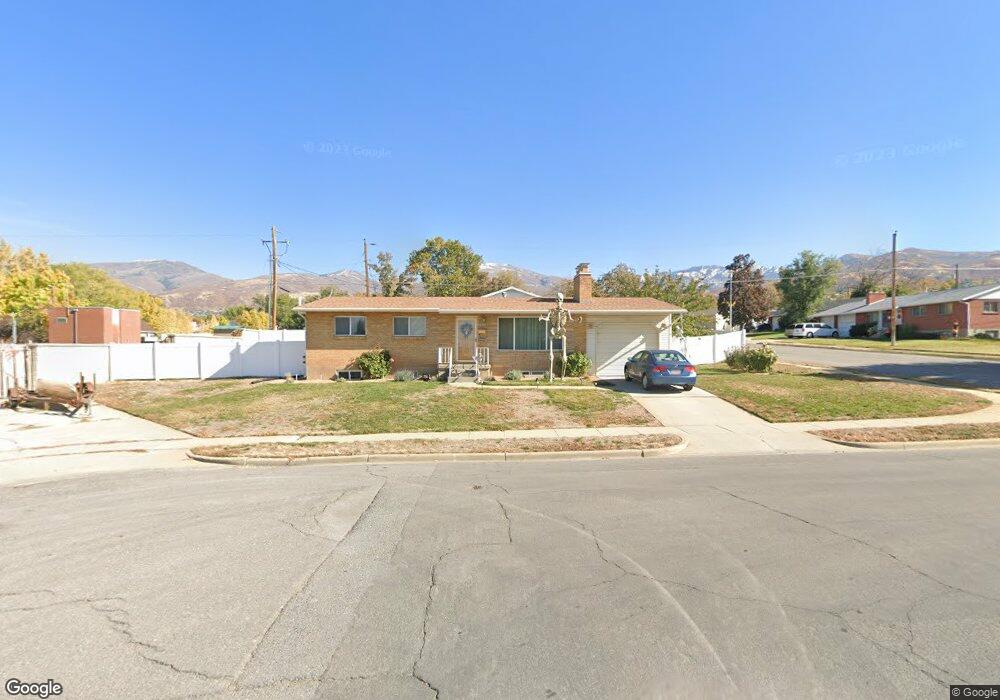
1595 S 100 E Bountiful, UT 84010
Estimated Value: $518,000 - $573,000
5
Beds
3
Baths
2,322
Sq Ft
$240/Sq Ft
Est. Value
About This Home
This home is located at 1595 S 100 E, Bountiful, UT 84010 and is currently estimated at $557,362, approximately $240 per square foot. 1595 S 100 E is a home located in Davis County with nearby schools including Bountiful Elementary School, Mueller Park Junior High School, and Bountiful High School.
Ownership History
Date
Name
Owned For
Owner Type
Purchase Details
Closed on
Sep 18, 2020
Sold by
Levano Johnson R and Levano Whitney
Bought by
Dearden Charles and Dearden Susan
Current Estimated Value
Home Financials for this Owner
Home Financials are based on the most recent Mortgage that was taken out on this home.
Original Mortgage
$363,750
Outstanding Balance
$319,858
Interest Rate
2.9%
Mortgage Type
New Conventional
Estimated Equity
$237,504
Purchase Details
Closed on
Nov 30, 2017
Sold by
Qazzaz Samar Al and Qaderi Mohammed Al
Bought by
Levano Johnson R and Levano Whitney
Purchase Details
Closed on
Mar 8, 2002
Sold by
Jones Earl S and Helen Jones M
Bought by
Jones Earl S and Helen Jones M
Create a Home Valuation Report for This Property
The Home Valuation Report is an in-depth analysis detailing your home's value as well as a comparison with similar homes in the area
Purchase History
| Date | Buyer | Sale Price | Title Company |
|---|---|---|---|
| Dearden Charles | -- | Backman Title Service | |
| Levano Johnson R | -- | Mountain View Title | |
| Jones Earl S | -- | -- |
Source: Public Records
Mortgage History
| Date | Status | Borrower | Loan Amount |
|---|---|---|---|
| Open | Dearden Charles | $363,750 |
Source: Public Records
Tax History
| Year | Tax Paid | Tax Assessment Tax Assessment Total Assessment is a certain percentage of the fair market value that is determined by local assessors to be the total taxable value of land and additions on the property. | Land | Improvement |
|---|---|---|---|---|
| 2025 | $3,084 | $281,600 | $122,394 | $159,206 |
| 2024 | $2,877 | $272,250 | $108,400 | $163,850 |
| 2023 | $2,756 | $473,000 | $200,363 | $272,637 |
| 2022 | $2,926 | $276,100 | $109,660 | $166,440 |
| 2021 | $2,681 | $387,000 | $143,475 | $243,525 |
| 2020 | $2,388 | $346,000 | $122,795 | $223,205 |
| 2019 | $2,262 | $319,000 | $131,293 | $187,707 |
| 2018 | $2,112 | $293,000 | $128,735 | $164,265 |
| 2016 | $1,704 | $127,325 | $52,930 | $74,395 |
| 2015 | $1,633 | $114,950 | $52,930 | $62,020 |
| 2014 | $318 | $124,033 | $52,930 | $71,103 |
| 2013 | -- | $104,585 | $41,748 | $62,837 |
Source: Public Records
Map
Nearby Homes
- 141 E 1650 S
- 288 E 1650 S
- 1820 S 50 W
- 380 E 1500 S
- 285 E 1100 S
- 190 W 1800 S
- 2 E Wicker Ln
- 2064 S Orchard Dr
- 188 E 2050 S Unit D3
- 1350 S 200 W
- 296 E 2050 S Unit 2
- 2059 S 350 E Unit 6
- 1314 S 200 W Unit 19
- 2038 S 350 E Unit 3
- 1886 S Jeri Dr
- 2046 S 350 E Unit 4
- 1940 S 200 W Unit 3
- 295 E 2050 S Unit 1
- 2053 S 350 E Unit 7
- 41 E 2200 S
Your Personal Tour Guide
Ask me questions while you tour the home.