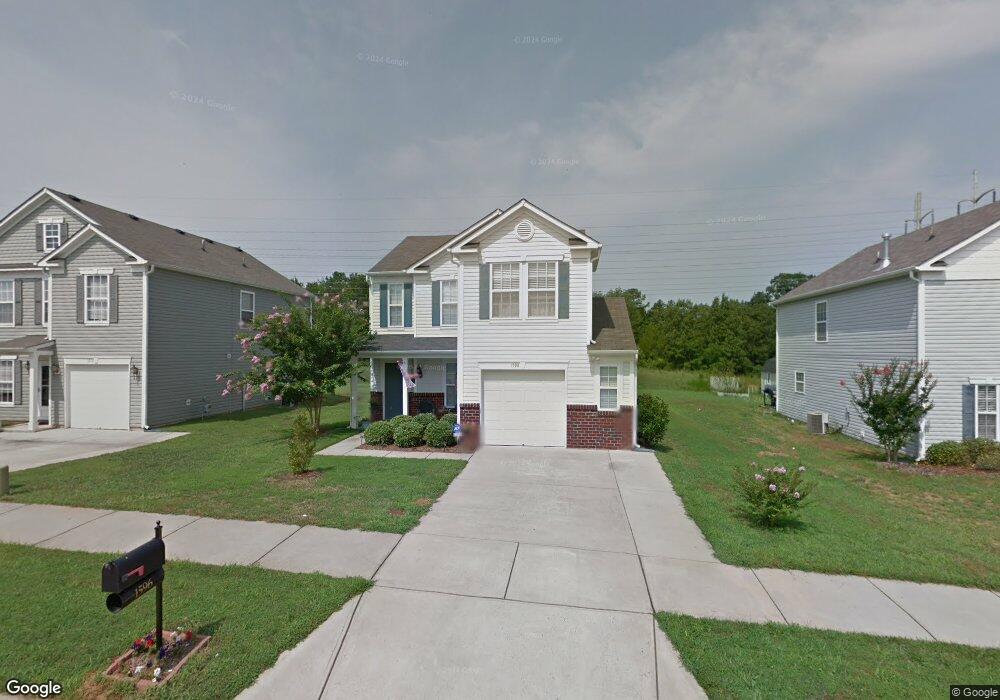
1596 Matthew Allen Cir Unit 32 Kannapolis, NC 28081
Estimated Value: $292,000 - $313,891
3
Beds
3
Baths
1,555
Sq Ft
$196/Sq Ft
Est. Value
About This Home
This home is located at 1596 Matthew Allen Cir Unit 32, Kannapolis, NC 28081 and is currently estimated at $304,973, approximately $196 per square foot. 1596 Matthew Allen Cir Unit 32 is a home located in Cabarrus County with nearby schools including Winecoff Elementary School, Northwest Cabarrus Middle School, and Northwest Cabarrus High.
Ownership History
Date
Name
Owned For
Owner Type
Purchase Details
Closed on
Dec 19, 2018
Sold by
The Meletis Family Limited Partnership
Bought by
Fete And Vivian Meletis Llc
Current Estimated Value
Purchase Details
Closed on
Apr 13, 2016
Sold by
Weigand Jessica R
Bought by
Meletis Family Limited Partnership Llc
Purchase Details
Closed on
Feb 24, 2006
Sold by
C P Morgan Communities Of Charlotte Llc
Bought by
Wiegand Jessica R
Home Financials for this Owner
Home Financials are based on the most recent Mortgage that was taken out on this home.
Original Mortgage
$105,708
Interest Rate
6.04%
Mortgage Type
Fannie Mae Freddie Mac
Purchase Details
Closed on
Oct 19, 2005
Sold by
Craft Development Llc
Bought by
C P Morgan Communities Of Charlotte Llc
Create a Home Valuation Report for This Property
The Home Valuation Report is an in-depth analysis detailing your home's value as well as a comparison with similar homes in the area
Home Values in the Area
Average Home Value in this Area
Purchase History
| Date | Buyer | Sale Price | Title Company |
|---|---|---|---|
| Fete And Vivian Meletis Llc | -- | None Available | |
| Meletis Family Limited Partnership Llc | $127,000 | City Of Oaks Title Llc | |
| Wiegand Jessica R | $132,500 | None Available | |
| C P Morgan Communities Of Charlotte Llc | $400,000 | -- |
Source: Public Records
Mortgage History
| Date | Status | Borrower | Loan Amount |
|---|---|---|---|
| Previous Owner | Wiegand Jessica R | $105,708 |
Source: Public Records
Tax History Compared to Growth
Tax History
| Year | Tax Paid | Tax Assessment Tax Assessment Total Assessment is a certain percentage of the fair market value that is determined by local assessors to be the total taxable value of land and additions on the property. | Land | Improvement |
|---|---|---|---|---|
| 2025 | $3,464 | $305,070 | $65,000 | $240,070 |
| 2024 | $3,464 | $305,070 | $65,000 | $240,070 |
| 2023 | $2,263 | $165,160 | $38,000 | $127,160 |
| 2022 | $2,263 | $165,160 | $38,000 | $127,160 |
| 2021 | $2,263 | $165,160 | $38,000 | $127,160 |
| 2020 | $2,263 | $165,160 | $38,000 | $127,160 |
| 2019 | $1,633 | $119,180 | $20,000 | $99,180 |
| 2018 | $1,609 | $119,180 | $20,000 | $99,180 |
| 2017 | $1,585 | $119,180 | $20,000 | $99,180 |
| 2016 | $1,585 | $117,300 | $23,000 | $94,300 |
| 2015 | -- | $117,080 | $23,000 | $94,080 |
| 2014 | -- | $117,080 | $23,000 | $94,080 |
Source: Public Records
Map
Nearby Homes
- 1589 Matthew Allen Cir
- 1500 S Ridge Ave
- 1309 Red Birch Place
- 103 Crescent St
- 210 Brook St
- 1417 Azalea Ave
- 111 Landmark Dr
- 210 Cliffside Dr
- 1693 Azalea Ave
- 103 Carriage House Dr
- 307 Meadowood Cir
- 2116 S Main St
- 303 Odell St
- 1418 Oakwood Ave
- 1700 Azalea Ave
- 301 Briarcliff Dr
- 251 Briarcliff Dr
- 302 Suburban Ave
- 325 Briarcliff Dr
- 503 Eddleman Rd
- 1596 Matthew Allen Cir
- 1590 Matthew Allen Cir
- 1602 Matthew Allen Cir
- 1584 Matthew Allen Cir
- 1606 Matthew Allen Cir
- 1606 Matthew Allen Cir
- 1578 Matthew Allen Cir
- 1610 Matthew Allen Cir
- 1595 Matthew Allen Cir
- 1601 Matthew Allen Cir
- 1585 Matthew Allen Cir
- 1572 Matthew Allen Cir
- 1614 Matthew Allen Cir
- 1605 Matthew Allen Cir
- 1575 Matthew Allen Cir
- 1609 Matthew Allen Cir
- 1566 Matthew Allen Cir
- 1618 Matthew Allen Cir
- 1571 Matthew Allen Cir
- 1571 Matthew Allen Cir Unit 51