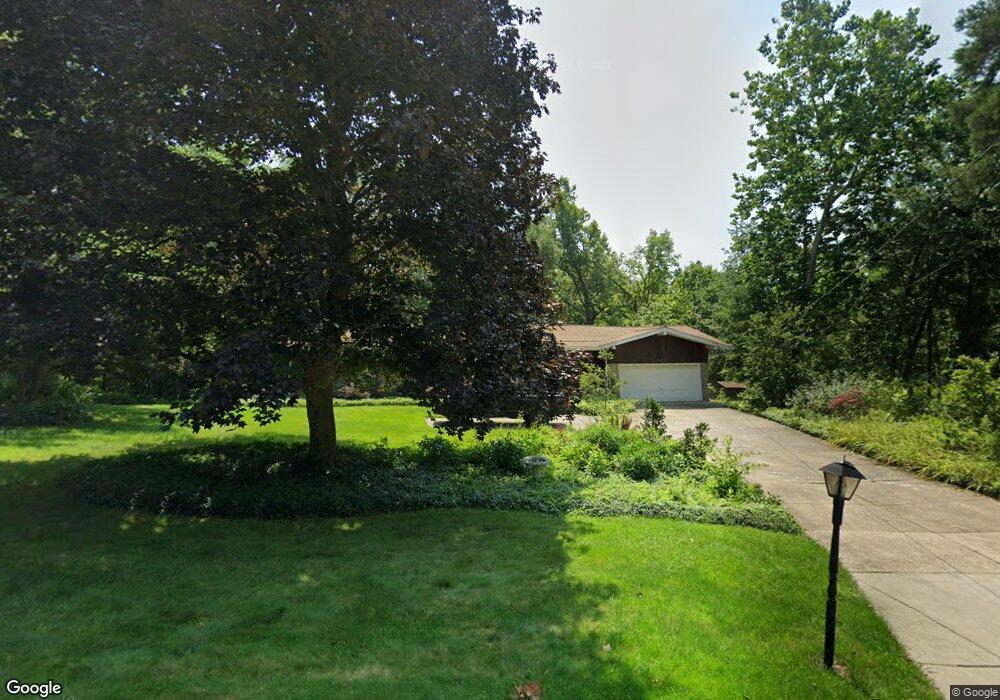
15969 Ridge Rd North Royalton, OH 44133
Estimated Value: $295,000 - $338,000
3
Beds
2
Baths
1,460
Sq Ft
$217/Sq Ft
Est. Value
About This Home
This home is located at 15969 Ridge Rd, North Royalton, OH 44133 and is currently estimated at $316,933, approximately $217 per square foot. 15969 Ridge Rd is a home located in Cuyahoga County with nearby schools including North Royalton Middle School, North Royalton High School, and Saint Albert the Great Roman Catholic School.
Ownership History
Date
Name
Owned For
Owner Type
Purchase Details
Closed on
Jun 26, 2003
Sold by
Colberg Robert J
Bought by
Mcnab Gary
Current Estimated Value
Purchase Details
Closed on
Feb 28, 1998
Sold by
Colberg Kathleen N
Bought by
Colberg Robert J
Home Financials for this Owner
Home Financials are based on the most recent Mortgage that was taken out on this home.
Original Mortgage
$21,993
Interest Rate
7.19%
Mortgage Type
Seller Take Back
Purchase Details
Closed on
Aug 6, 1993
Sold by
Bentley Noah J and Bentley Betty L
Bought by
Colberg Robert J
Purchase Details
Closed on
May 13, 1985
Sold by
Mcnab Richard D
Bought by
Bentley Noah J and Bentley Betty L
Purchase Details
Closed on
Mar 13, 1985
Sold by
Mcnab Richard D and Mcnab Phyllis M
Bought by
Mcnab Richard D
Purchase Details
Closed on
Jan 1, 1975
Bought by
Mcnab Richard D and Mcnab Phyllis M
Create a Home Valuation Report for This Property
The Home Valuation Report is an in-depth analysis detailing your home's value as well as a comparison with similar homes in the area
Home Values in the Area
Average Home Value in this Area
Purchase History
| Date | Buyer | Sale Price | Title Company |
|---|---|---|---|
| Mcnab Gary | $193,000 | Ata Title Agency | |
| Colberg Robert J | -- | -- | |
| Colberg Robert J | $144,000 | -- | |
| Bentley Noah J | $108,000 | -- | |
| Mcnab Richard D | -- | -- | |
| Mcnab Richard D | -- | -- |
Source: Public Records
Mortgage History
| Date | Status | Borrower | Loan Amount |
|---|---|---|---|
| Previous Owner | Colberg Robert J | $21,993 |
Source: Public Records
Tax History Compared to Growth
Tax History
| Year | Tax Paid | Tax Assessment Tax Assessment Total Assessment is a certain percentage of the fair market value that is determined by local assessors to be the total taxable value of land and additions on the property. | Land | Improvement |
|---|---|---|---|---|
| 2024 | $5,524 | $95,095 | $26,600 | $68,495 |
| 2023 | $5,252 | $82,710 | $21,040 | $61,670 |
| 2022 | $5,216 | $82,710 | $21,040 | $61,670 |
| 2021 | $5,272 | $82,710 | $21,040 | $61,670 |
| 2020 | $4,662 | $69,510 | $17,680 | $51,840 |
| 2019 | $4,526 | $198,600 | $50,500 | $148,100 |
| 2018 | $4,320 | $69,510 | $17,680 | $51,840 |
| 2017 | $4,338 | $63,010 | $11,660 | $51,350 |
| 2016 | $4,066 | $63,010 | $11,660 | $51,350 |
| 2015 | $3,725 | $63,010 | $11,660 | $51,350 |
| 2014 | $3,725 | $57,270 | $10,610 | $46,660 |
Source: Public Records
Map
Nearby Homes
- 7400 Akins Rd
- 16577 State Rd
- 9447 Lindberg Dr
- 6360 Cady Rd
- 0 Valley Pkwy Unit 5118483
- 5469 Riverview Dr
- 8381 N Akins Rd Unit H7
- 13831 Woodcroft Trace
- 5299 Whistler Ct
- 10281 River Run Ln
- 19345 Ridge Rd
- 5213 Royalton Rd
- 4428 Akins Rd
- BUCHANAN Plan at Pine Hill
- HALEY Plan at Pine Hill
- CHAMP Plan at Pine Hill
- VANDERBURGH Plan at Pine Hill
- BELLEVILLE Plan at Pine Hill
- SEBASTIAN Plan at Pine Hill
- NORTHWOOD Plan at Pine Hill
- 15969 Ridge Rd
- 15961 Ridge Rd
- 16297 Ridge Rd
- 16317 Ridge Rd
- 16070 Ridge Rd
- 16000 Ridge Rd
- 16577 Ridge Rd
- 7920 Edgerton Rd
- 15951 Ridge Rd
- 16665 Ridge Rd
- 7432 Edgerton Rd
- 7420 Edgerton Rd
- 7406 Edgerton Rd
- 7276 Edgerton Rd
- 16678 Ridge Rd
- 7300 Edgerton Rd
- 7374 Edgerton Rd
- 6964 Edgerton Rd
- 7288 Edgerton Rd
- 8000 Edgerton Rd