Estimated Value: $566,000 - $648,000
3
Beds
2
Baths
1,600
Sq Ft
$386/Sq Ft
Est. Value
About This Home
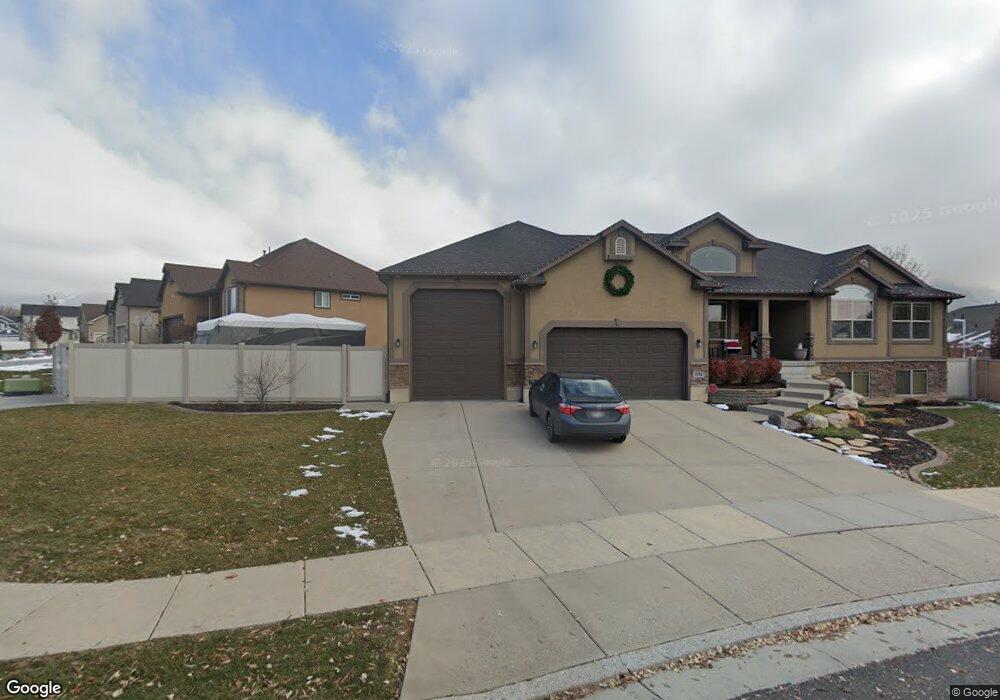
This home is located at 1598 N 200 W, Ogden, UT 84404 and is currently estimated at $618,041, approximately $386 per square foot. 1598 N 200 W is a home located in Weber County with nearby schools including Pioneer School, Orion Junior High School, and Weber High School.
Ownership History
Date
Name
Owned For
Owner Type
Purchase Details
Closed on
May 22, 2020
Sold by
Canning Jeff R
Bought by
Canning Jeff R and Canning Amber S
Current Estimated Value
Home Financials for this Owner
Home Financials are based on the most recent Mortgage that was taken out on this home.
Original Mortgage
$306,200
Outstanding Balance
$271,336
Interest Rate
3.3%
Mortgage Type
New Conventional
Estimated Equity
$346,705
Purchase Details
Closed on
Jun 25, 2015
Sold by
Robinson Jess D and Robinson Sabrina B
Bought by
Canning Jeff R
Home Financials for this Owner
Home Financials are based on the most recent Mortgage that was taken out on this home.
Original Mortgage
$308,460
Interest Rate
3.81%
Mortgage Type
New Conventional
Purchase Details
Closed on
May 16, 2008
Sold by
Nilson & Co Inc
Bought by
Robinson Jess D and Robinson Sabrina B
Home Financials for this Owner
Home Financials are based on the most recent Mortgage that was taken out on this home.
Original Mortgage
$271,330
Interest Rate
5.88%
Mortgage Type
Purchase Money Mortgage
Create a Home Valuation Report for This Property
The Home Valuation Report is an in-depth analysis detailing your home's value as well as a comparison with similar homes in the area
Home Values in the Area
Average Home Value in this Area
Purchase History
| Date | Buyer | Sale Price | Title Company |
|---|---|---|---|
| Canning Jeff R | -- | Inwest Title South Ogden | |
| Canning Jeff R | -- | Stewart Title Ins Agency Of | |
| Robinson Jess D | -- | Bonneville Superior Title Co | |
| Nilson & Co Inc | -- | Lincoln Title Ins Agency |
Source: Public Records
Mortgage History
| Date | Status | Borrower | Loan Amount |
|---|---|---|---|
| Open | Canning Jeff R | $306,200 | |
| Closed | Canning Jeff R | $308,460 | |
| Previous Owner | Robinson Jess D | $271,330 |
Source: Public Records
Tax History Compared to Growth
Tax History
| Year | Tax Paid | Tax Assessment Tax Assessment Total Assessment is a certain percentage of the fair market value that is determined by local assessors to be the total taxable value of land and additions on the property. | Land | Improvement |
|---|---|---|---|---|
| 2025 | $3,964 | $612,426 | $182,695 | $429,731 |
| 2024 | $3,964 | $604,000 | $182,695 | $421,305 |
| 2023 | $3,814 | $590,000 | $181,902 | $408,098 |
| 2022 | $3,536 | $308,550 | $88,995 | $219,555 |
| 2021 | $3,094 | $461,000 | $101,274 | $359,726 |
| 2020 | $2,803 | $389,000 | $79,518 | $309,482 |
| 2019 | $2,701 | $360,000 | $79,518 | $280,482 |
| 2018 | $2,755 | $353,000 | $74,499 | $278,501 |
| 2017 | $2,657 | $321,000 | $74,336 | $246,664 |
| 2016 | $2,423 | $157,150 | $36,762 | $120,388 |
| 2015 | $2,289 | $146,663 | $29,334 | $117,329 |
| 2014 | $2,044 | $126,844 | $29,334 | $97,510 |
Source: Public Records
Map
Nearby Homes
- 112 E 1475 N
- 149 W 1250 N
- 247 E 1825 N Unit 12
- 247 E 1825 N Unit 10
- 247 E 1825 N Unit 8
- 247 E 1825 N Unit 4
- 1260 N 100 E
- 258 E 1500 N
- 1755 N 350 W
- 310 E 1650 #132 N
- 1135 Connecticut Ave
- 1135 150 W
- 1754 N 300 E Unit 116
- 2458 N Highway 89 Hwy
- Harris Plan at Ashlar Cove
- 1196 N 375 W Unit 1
- Dearborn Plan at Ashlar Cove
- 247 E 1850 N Unit 2
- Seneca Plan at Prominence Point
- Marion Plan at Prominence Point