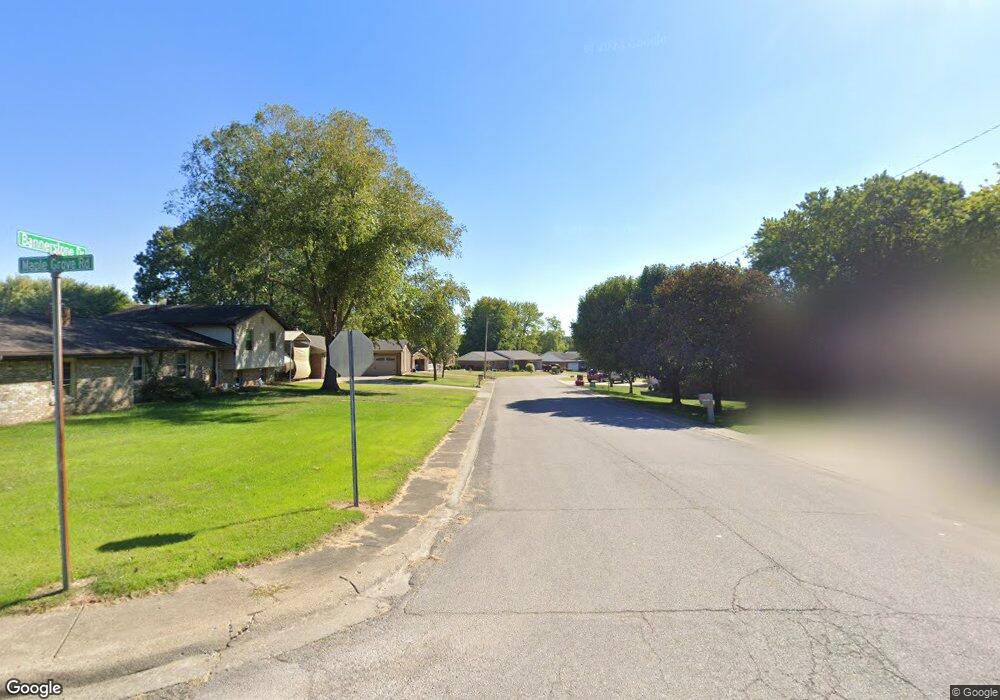
1599 Maple Grove Rd Boonville, IN 47601
Estimated Value: $129,000 - $209,000
2
Beds
1
Bath
800
Sq Ft
$211/Sq Ft
Est. Value
About This Home
This home is located at 1599 Maple Grove Rd, Boonville, IN 47601 and is currently estimated at $169,000, approximately $211 per square foot. 1599 Maple Grove Rd is a home located in Warrick County with nearby schools including Oakdale Elementary School, Boonville Middle School, and Boonville High School.
Ownership History
Date
Name
Owned For
Owner Type
Purchase Details
Closed on
Sep 17, 2021
Sold by
Ers Management Llc
Bought by
Greenshield Properties Llc
Current Estimated Value
Home Financials for this Owner
Home Financials are based on the most recent Mortgage that was taken out on this home.
Original Mortgage
$112,130
Outstanding Balance
$94,422
Interest Rate
2.8%
Mortgage Type
Commercial
Estimated Equity
$74,578
Purchase Details
Closed on
Mar 27, 2019
Sold by
Brighton Bank
Bought by
Ers Mangagement Llc
Home Financials for this Owner
Home Financials are based on the most recent Mortgage that was taken out on this home.
Original Mortgage
$455,153
Interest Rate
4.3%
Mortgage Type
Commercial
Purchase Details
Closed on
Jun 20, 2016
Sold by
Evans Ronald J
Bought by
Carbah Christopher L
Purchase Details
Closed on
Dec 23, 2009
Sold by
Evans Ronald J and Evans Rebecca L
Bought by
Evans Ronald J and Evans Rebecca L
Create a Home Valuation Report for This Property
The Home Valuation Report is an in-depth analysis detailing your home's value as well as a comparison with similar homes in the area
Home Values in the Area
Average Home Value in this Area
Purchase History
| Date | Buyer | Sale Price | Title Company |
|---|---|---|---|
| Greenshield Properties Llc | $102,000 | None Available | |
| Ers Mangagement Llc | -- | None Available | |
| Carbah Christopher L | $56,000 | -- | |
| Evans Ronald J | -- | None Available |
Source: Public Records
Mortgage History
| Date | Status | Borrower | Loan Amount |
|---|---|---|---|
| Open | Greenshield Properties Llc | $112,130 | |
| Previous Owner | Ers Mangagement Llc | $455,153 |
Source: Public Records
Tax History Compared to Growth
Tax History
| Year | Tax Paid | Tax Assessment Tax Assessment Total Assessment is a certain percentage of the fair market value that is determined by local assessors to be the total taxable value of land and additions on the property. | Land | Improvement |
|---|---|---|---|---|
| 2024 | $1,292 | $64,600 | $6,300 | $58,300 |
| 2023 | $1,292 | $64,600 | $6,300 | $58,300 |
| 2022 | $1,292 | $64,600 | $6,300 | $58,300 |
| 2021 | $1,292 | $64,600 | $6,300 | $58,300 |
| 2020 | $1,352 | $64,600 | $6,300 | $58,300 |
| 2019 | $1,352 | $64,600 | $6,300 | $58,300 |
| 2018 | $1,292 | $64,600 | $6,300 | $58,300 |
| 2017 | $2,713 | $64,600 | $6,300 | $58,300 |
| 2016 | -- | $64,600 | $6,300 | $58,300 |
Source: Public Records
Map
Nearby Homes
- 1555 W Maple Grove Rd
- 1311 S 2nd St
- 1255 Maple Grove Rd
- 1306 S 1st St
- 0 Washington St Unit 202539739
- 1877 Maple Grove Rd
- 420 E Moore St
- 603 E Moore St
- 902 Maxville Rd
- 424 E Oak St
- 211 E Division St
- 255 Tower Dr
- 1514 Mac-Ray Dr
- 407 S 8th St
- 403 S 8th St
- 625 E Walnut St
- 510 W Walnut St
- 504 W Locust St
- 613 W Walnut St
- 0 Brimm St
- 1533 W Maple Grove Rd
- 1533 Maple Grove Rd
- 1511 Maple Grove Rd
- 1511 W Maple Grove Rd
- 1577 Maple Grove Rd
- 1577 Maple Grove Rd
- 1499 Maple Grove Rd
- 1702 Bannerstone Dr
- 1704 Bannerstone Dr
- 1708 Bannerstone Dr
- 1509 Autumn Dr
- 1505 Autumn Dr
- 1519 Autumn Dr
- 1523 Autumn Dr
- 1517 Autumn Dr
- 1515 Autumn Dr
- 1513 Autumn Dr
- 1511 Autumn Dr
- 1503 Autumn Dr
- 1501 Autumn Dr