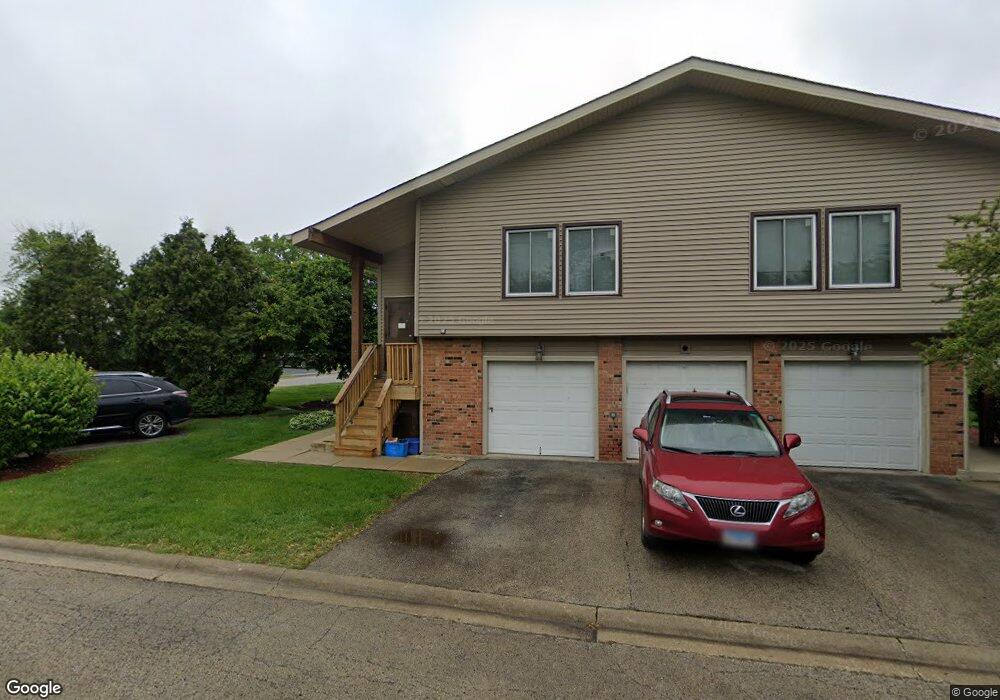
15C Marywood Ln Unit 2 Bolingbrook, IL 60440
East Bolingbrook NeighborhoodEstimated Value: $177,000 - $221,000
3
Beds
1
Bath
1,180
Sq Ft
$169/Sq Ft
Est. Value
About This Home
This home is located at 15C Marywood Ln Unit 2, Bolingbrook, IL 60440 and is currently estimated at $199,462, approximately $169 per square foot. 15C Marywood Ln Unit 2 is a home located in Will County with nearby schools including Wood View Elementary School, Bolingbrook High School, and Midwest Christian Montessori Academy.
Ownership History
Date
Name
Owned For
Owner Type
Purchase Details
Closed on
Oct 6, 2015
Sold by
Gangwani Kishore
Bought by
K3 Llc Series 15C Marywood
Current Estimated Value
Purchase Details
Closed on
Mar 20, 2015
Sold by
Chaudhry Muhammad Riaz and Chaudhry Nagina K
Bought by
Gangwani Kishore
Purchase Details
Closed on
Oct 9, 2014
Sold by
Whiting Vernon K and Whiting Lutisha Jefferson
Bought by
Chaudhry Mohammed R
Purchase Details
Closed on
Jul 31, 2014
Sold by
Whiting Vernon K and Whiting Lutisha Jefferson
Bought by
Chaundhry Mohammed R
Purchase Details
Closed on
Sep 30, 2003
Sold by
Kinser James and Kinser Laura
Bought by
Whiting Vernon K
Home Financials for this Owner
Home Financials are based on the most recent Mortgage that was taken out on this home.
Original Mortgage
$111,240
Interest Rate
6.49%
Mortgage Type
VA
Purchase Details
Closed on
Oct 25, 1994
Sold by
Rogers Mark E and Rogers Linda S
Bought by
Kinser James F and Kinser Laura J M
Home Financials for this Owner
Home Financials are based on the most recent Mortgage that was taken out on this home.
Original Mortgage
$50,800
Interest Rate
8%
Create a Home Valuation Report for This Property
The Home Valuation Report is an in-depth analysis detailing your home's value as well as a comparison with similar homes in the area
Home Values in the Area
Average Home Value in this Area
Purchase History
| Date | Buyer | Sale Price | Title Company |
|---|---|---|---|
| K3 Llc Series 15C Marywood | -- | None Available | |
| Gangwani Kishore | $89,000 | None Available | |
| Chaudhry Mohammed R | $44,227 | None Available | |
| Chaundhry Mohammed R | $44,227 | None Available | |
| Whiting Vernon K | $108,000 | Law Title | |
| Kinser James F | $63,500 | -- |
Source: Public Records
Mortgage History
| Date | Status | Borrower | Loan Amount |
|---|---|---|---|
| Previous Owner | Whiting Vernon K | $111,240 | |
| Previous Owner | Kinser James F | $50,800 |
Source: Public Records
Tax History Compared to Growth
Tax History
| Year | Tax Paid | Tax Assessment Tax Assessment Total Assessment is a certain percentage of the fair market value that is determined by local assessors to be the total taxable value of land and additions on the property. | Land | Improvement |
|---|---|---|---|---|
| 2024 | $4,269 | $46,219 | $4,735 | $41,484 |
| 2023 | $4,269 | $41,586 | $4,260 | $37,326 |
| 2022 | $3,513 | $35,538 | $3,641 | $31,897 |
| 2021 | $3,248 | $32,260 | $3,305 | $28,955 |
| 2020 | $3,034 | $29,999 | $3,073 | $26,926 |
| 2019 | $2,834 | $27,472 | $2,814 | $24,658 |
| 2018 | $2,454 | $23,628 | $2,420 | $21,208 |
| 2017 | $2,347 | $22,396 | $2,294 | $20,102 |
| 2016 | $1,557 | $20,500 | $2,100 | $18,400 |
| 2015 | $1,454 | $19,100 | $2,000 | $17,100 |
| 2014 | $1,454 | $19,100 | $2,000 | $17,100 |
| 2013 | $1,454 | $27,200 | $2,800 | $24,400 |
Source: Public Records
Map
Nearby Homes
- 8 Wildwood Ln Unit G
- 23 Wildwood Ln Unit G
- 3 Roanoke Ct
- 223 Hywood Ln
- 11 Roanoke Ct
- 6 Allegheny Ct
- 3 Merrimack Ct
- 227 Lexington Dr
- 2 Ava Ct
- 112 Brook Ct
- 109 Arrowhead Ln
- 222 Aspen Ct
- 124 Wedgewood Way
- 135 Barbers Corner Rd
- 100 Concord Ln
- 141 N Lancaster Dr
- 234 Dakota Ct Unit C
- 281 Dupage Dr
- 458 Ridge Ln
- 462 Ridge Ln
- 12 Marywood Ln Unit 12
- 15 Marywood Ln
- 15 Marywood Ln Unit C
- 14C Marywood Ln
- 14C Marywood Ln Unit C
- 14C Marywood Ln
- 13C Marywood Ln
- 12C Marywood Ln Unit 6
- 10C Marywood Ln
- 11 Marywood Ln Unit C
- 11C Marywood Ln
- 261 Juniper Ln
- 1C Marywood Ln
- 7C Marywood Ln Unit 1
- 9C Marywood Ln Unit C
- 9C Marywood Ln
- 9C Marywood Ln Unit 2
- 2C Marywood Ln Unit 2
- 3C Marywood Ln Unit 3
- 263 Juniper Ln