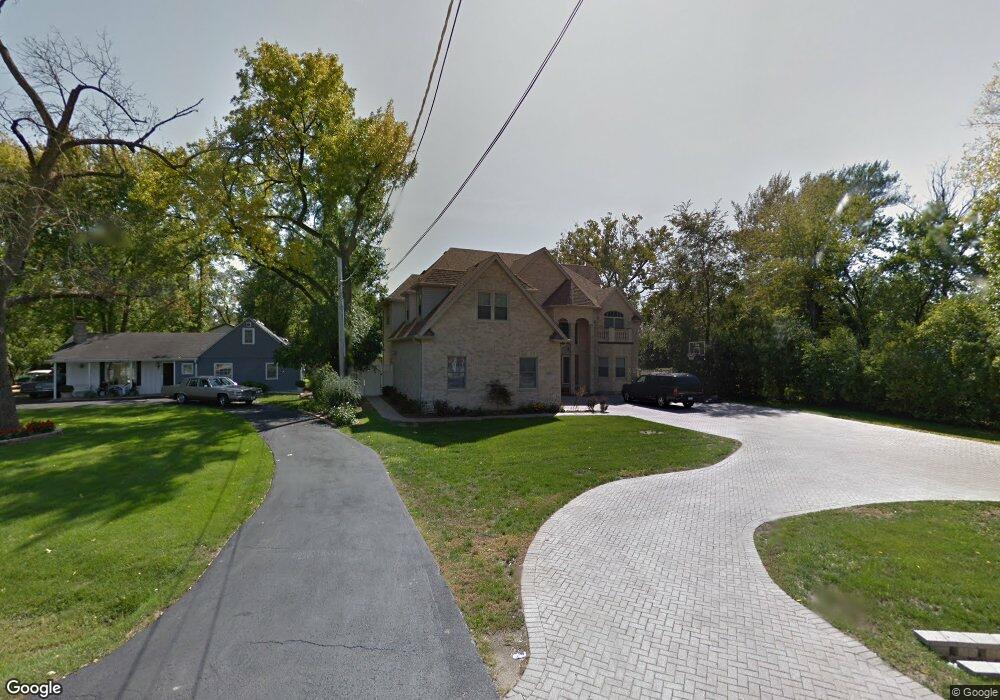
15W307 Lexington St Elmhurst, IL 60126
Estimated Value: $887,000 - $1,403,000
--
Bed
--
Bath
4,945
Sq Ft
$248/Sq Ft
Est. Value
About This Home
This home is located at 15W307 Lexington St, Elmhurst, IL 60126 and is currently estimated at $1,226,672, approximately $248 per square foot. 15W307 Lexington St is a home located in DuPage County with nearby schools including Pulaski Intl School of Chicago, Revere Elementary School, and Jackson Elementary School.
Ownership History
Date
Name
Owned For
Owner Type
Purchase Details
Closed on
Feb 4, 2021
Sold by
Brandy Tyrone N and Brandy Requita
Bought by
Brandy Family Trust and Brandy
Current Estimated Value
Purchase Details
Closed on
May 26, 2004
Sold by
Cotham Larry T and Cotham Mary C
Bought by
Requita Brandy Tyrone N and Requita Brandy
Home Financials for this Owner
Home Financials are based on the most recent Mortgage that was taken out on this home.
Original Mortgage
$260,000
Interest Rate
3.75%
Mortgage Type
Purchase Money Mortgage
Purchase Details
Closed on
Aug 1, 2001
Sold by
Young Roger A and Young Patricia L
Bought by
Cotham Larry T and Cotham Mary C
Home Financials for this Owner
Home Financials are based on the most recent Mortgage that was taken out on this home.
Original Mortgage
$172,500
Interest Rate
7.23%
Create a Home Valuation Report for This Property
The Home Valuation Report is an in-depth analysis detailing your home's value as well as a comparison with similar homes in the area
Home Values in the Area
Average Home Value in this Area
Purchase History
| Date | Buyer | Sale Price | Title Company |
|---|---|---|---|
| Brandy Family Trust | -- | None Listed On Document | |
| Requita Brandy Tyrone N | $380,000 | Chicago Title Insurance Comp | |
| Cotham Larry T | $230,000 | First American Title |
Source: Public Records
Mortgage History
| Date | Status | Borrower | Loan Amount |
|---|---|---|---|
| Previous Owner | Requita Brandy Tyrone N | $260,000 | |
| Previous Owner | Cotham Larry T | $172,500 |
Source: Public Records
Tax History Compared to Growth
Tax History
| Year | Tax Paid | Tax Assessment Tax Assessment Total Assessment is a certain percentage of the fair market value that is determined by local assessors to be the total taxable value of land and additions on the property. | Land | Improvement |
|---|---|---|---|---|
| 2024 | $19,754 | $376,868 | $91,508 | $285,360 |
| 2023 | $18,879 | $348,500 | $84,620 | $263,880 |
| 2022 | $18,123 | $335,010 | $81,340 | $253,670 |
| 2021 | $17,603 | $326,680 | $79,320 | $247,360 |
| 2020 | $16,787 | $319,520 | $77,580 | $241,940 |
| 2019 | $15,933 | $303,780 | $73,760 | $230,020 |
| 2018 | $17,509 | $330,220 | $69,840 | $260,380 |
| 2017 | $17,076 | $314,670 | $66,550 | $248,120 |
| 2016 | $16,731 | $296,430 | $62,690 | $233,740 |
| 2015 | $16,504 | $276,160 | $58,400 | $217,760 |
| 2014 | $18,406 | $285,660 | $52,150 | $233,510 |
| 2013 | $17,977 | $289,680 | $52,880 | $236,800 |
Source: Public Records
Map
Nearby Homes
- 15W320 Concord St
- 426 E Harrison St
- 353 E Butterfield Rd
- 900 S Colfax Ave
- 0S424 S Cadwell Ave
- 162 E Hale St
- 837 S Kearsage Ave
- 522 E Park Manor Ct
- 341 E Madison St
- 110 W Butterfield Rd Unit 502S
- 705 S Edgewood Ave
- 494 E Atwood Ct
- 505 E Atwood Ct
- 675 S Edgewood Ave
- 185 E Oneida Ave
- 175 W Brush Hill Rd Unit 404
- 274 E Crescent Ave
- 806 Wildwood Ct
- 1005 S Mitchell Ave
- 694 S York St
- 15W279 Lexington St
- 15W319 Lexington St
- 15W267 Lexington St
- 15W310 Concord St
- 373 E Lexington St
- 15W331 Lexington St
- 15W306 Lexington St
- 369 E Lexington St
- 15W253 Lexington St
- 15W330 Concord St
- 15W320 Lexington St
- 377 E Lexington St
- 381 E Lexington St
- 15W345 Lexington St
- 15W280 Concord St
- 15W346 Concord St
- 15W332 Lexington St
- 15W243 Lexington St
- 15W268 Concord St
- 15W355 Lexington St