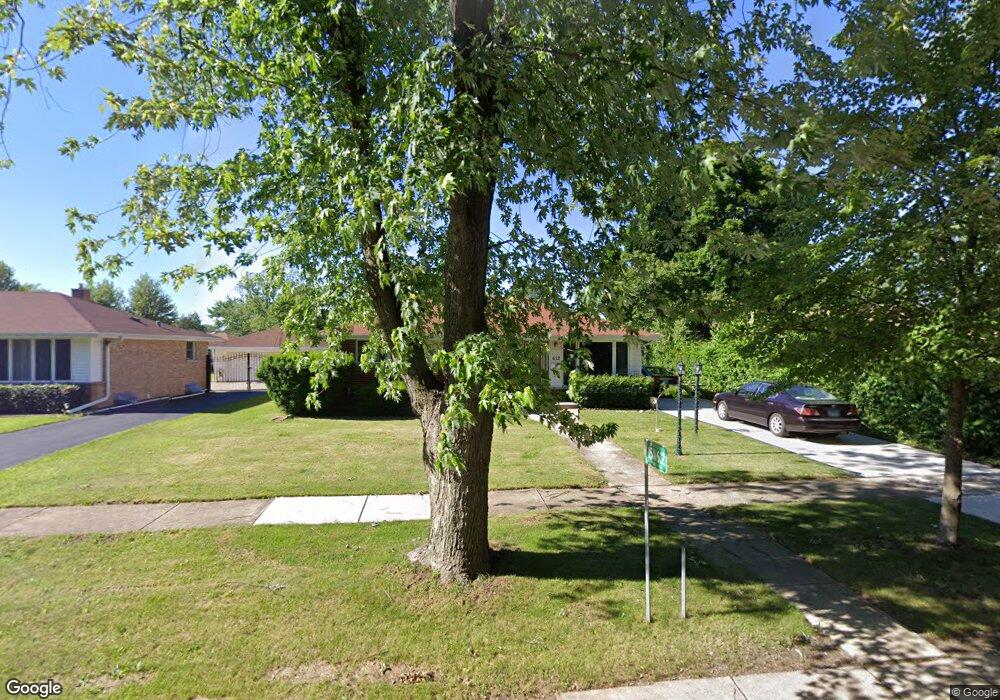
15W612 Wrightwood Ave Elmhurst, IL 60126
Estimated Value: $360,000 - $409,000
4
Beds
2
Baths
1,080
Sq Ft
$357/Sq Ft
Est. Value
About This Home
This home is located at 15W612 Wrightwood Ave, Elmhurst, IL 60126 and is currently estimated at $385,953, approximately $357 per square foot. 15W612 Wrightwood Ave is a home located in DuPage County with nearby schools including Conrad Fischer Elementary School, Churchville Middle School, and York Community High School.
Ownership History
Date
Name
Owned For
Owner Type
Purchase Details
Closed on
Mar 15, 2017
Sold by
Perroy Lazo O and Perroy Deirore
Bought by
Durante Jeffrey S and Durante Ellen B
Current Estimated Value
Home Financials for this Owner
Home Financials are based on the most recent Mortgage that was taken out on this home.
Original Mortgage
$240,562
Outstanding Balance
$197,115
Interest Rate
3.75%
Mortgage Type
FHA
Estimated Equity
$188,838
Purchase Details
Closed on
Mar 1, 2017
Sold by
Tellone Patrick A and Tellone Margo A
Bought by
Durante Jeffrey S and Durante Ellen B
Home Financials for this Owner
Home Financials are based on the most recent Mortgage that was taken out on this home.
Original Mortgage
$240,562
Outstanding Balance
$197,115
Interest Rate
3.75%
Mortgage Type
FHA
Estimated Equity
$188,838
Purchase Details
Closed on
May 31, 2016
Sold by
Perroy Lazo D and Tellone Margo
Bought by
The Patrick A Tellone & Margo A Tellone
Create a Home Valuation Report for This Property
The Home Valuation Report is an in-depth analysis detailing your home's value as well as a comparison with similar homes in the area
Home Values in the Area
Average Home Value in this Area
Purchase History
| Date | Buyer | Sale Price | Title Company |
|---|---|---|---|
| Durante Jeffrey S | $122,500 | Greater Illions Title | |
| Durante Jeffrey S | $122,500 | Greater Illinois Title | |
| The Patrick A Tellone & Margo A Tellone | -- | Attorney |
Source: Public Records
Mortgage History
| Date | Status | Borrower | Loan Amount |
|---|---|---|---|
| Open | Durante Jeffrey S | $240,562 | |
| Closed | Durante Jeffrey S | $240,562 |
Source: Public Records
Tax History Compared to Growth
Tax History
| Year | Tax Paid | Tax Assessment Tax Assessment Total Assessment is a certain percentage of the fair market value that is determined by local assessors to be the total taxable value of land and additions on the property. | Land | Improvement |
|---|---|---|---|---|
| 2024 | $6,260 | $115,514 | $54,695 | $60,819 |
| 2023 | $5,752 | $106,190 | $50,280 | $55,910 |
| 2022 | $5,316 | $97,940 | $46,330 | $51,610 |
| 2021 | $5,063 | $93,810 | $44,380 | $49,430 |
| 2020 | $4,739 | $89,860 | $42,510 | $47,350 |
| 2019 | $4,690 | $86,400 | $40,870 | $45,530 |
| 2018 | $4,494 | $82,290 | $38,920 | $43,370 |
| 2017 | $4,383 | $78,650 | $37,200 | $41,450 |
| 2016 | $4,190 | $72,620 | $34,350 | $38,270 |
| 2015 | $4,081 | $67,080 | $31,730 | $35,350 |
| 2014 | $3,873 | $59,970 | $30,800 | $29,170 |
| 2013 | $3,838 | $61,190 | $31,430 | $29,760 |
Source: Public Records
Map
Nearby Homes
- 841 N York St Unit 129
- 758 N Kenilworth Ave
- 909 N Addison Ave
- 337 E Fullerton Ave
- 738 N Parker St
- 728 N Parker St
- 1043 S York Rd Unit 208
- 1043 S York Rd Unit 411
- 132 E Gladys Ave
- 564 N Adele St
- 516 N Emroy Ave
- 128 David Dr
- 251 W Armitage Ave
- 456 N Elm Ave
- 1010 Judson St Unit 2A
- 342 Diana Ct
- 183 E Grantley Ave
- 311 George St
- 809 Brentwood Dr
- 234 E Grantley Ave
- 15W620 Wrightwood Ave
- 15W600 Wrightwood Ave
- 15W628 Wrightwood Ave
- 15W582 Wrightwood Ave
- 15W611 Victory Pkwy
- 15W572 Wrightwood Ave
- 15W627 Victory Pkwy
- 15W581 Victory Pkwy
- 15W619 Victory Pkwy
- 15W601 Victory Pkwy
- 3N221 N Indiana St
- 15W571 Victory Pkwy
- 3N235 N Indiana St
- 3N210 Wilson St
- 3N220 Wilson St
- 3N210 N Indiana St
- 3N230 Wilson St
- 823 N Willow Rd
- 3N224 N Indiana St
- 15W604 Victory Pkwy