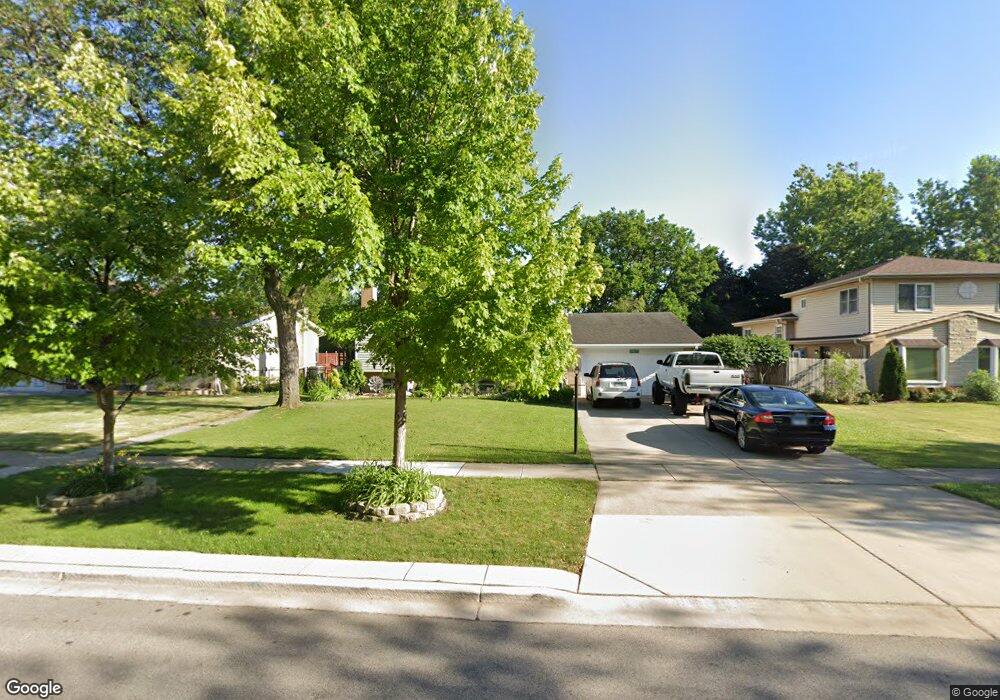
15W673 Virginia Ln Elmhurst, IL 60126
Estimated Value: $419,364
3
Beds
2
Baths
1,895
Sq Ft
$221/Sq Ft
Est. Value
About This Home
This home is located at 15W673 Virginia Ln, Elmhurst, IL 60126 and is currently priced at $419,364, approximately $221 per square foot. 15W673 Virginia Ln is a home located in DuPage County with nearby schools including Conrad Fischer Elementary School, Churchville Middle School, and York Community High School.
Ownership History
Date
Name
Owned For
Owner Type
Purchase Details
Closed on
Feb 19, 2018
Sold by
Hussain Syed K and Hussain Mahar U
Bought by
621 Estate Llc
Current Estimated Value
Purchase Details
Closed on
Jan 13, 2011
Sold by
Hussain Syed K
Bought by
Hussain Syed K and Hussain Mahar U
Purchase Details
Closed on
Apr 28, 2010
Sold by
Us Bank National Association
Bought by
Hussain Syed
Purchase Details
Closed on
Nov 24, 2009
Sold by
Felx Ana Maria
Bought by
Us Bank National Association
Purchase Details
Closed on
May 31, 2005
Sold by
Felix Ana Maria
Bought by
Felix Ana Maria
Home Financials for this Owner
Home Financials are based on the most recent Mortgage that was taken out on this home.
Original Mortgage
$369,000
Interest Rate
5.98%
Mortgage Type
Credit Line Revolving
Purchase Details
Closed on
Jun 4, 1997
Sold by
Felix Ana Maria
Bought by
Felix Ana Maria
Create a Home Valuation Report for This Property
The Home Valuation Report is an in-depth analysis detailing your home's value as well as a comparison with similar homes in the area
Home Values in the Area
Average Home Value in this Area
Purchase History
| Date | Buyer | Sale Price | Title Company |
|---|---|---|---|
| 621 Estate Llc | -- | None Available | |
| Hussain Syed K | -- | None Available | |
| Hussain Syed | $199,000 | Ctic | |
| Us Bank National Association | -- | None Available | |
| Felix Ana Maria | -- | Ctic | |
| Felix Ana Maria | -- | -- |
Source: Public Records
Mortgage History
| Date | Status | Borrower | Loan Amount |
|---|---|---|---|
| Previous Owner | Felix Ana Maria | $369,000 |
Source: Public Records
Tax History Compared to Growth
Tax History
| Year | Tax Paid | Tax Assessment Tax Assessment Total Assessment is a certain percentage of the fair market value that is determined by local assessors to be the total taxable value of land and additions on the property. | Land | Improvement |
|---|---|---|---|---|
| 2024 | $9,566 | $164,302 | $54,695 | $109,607 |
| 2023 | $8,849 | $151,040 | $50,280 | $100,760 |
| 2022 | $8,039 | $139,030 | $46,330 | $92,700 |
| 2021 | $7,333 | $133,170 | $44,380 | $88,790 |
| 2020 | $6,869 | $127,560 | $42,510 | $85,050 |
| 2019 | $6,804 | $122,650 | $40,870 | $81,780 |
| 2018 | $6,568 | $117,490 | $38,920 | $78,570 |
| 2017 | $6,412 | $112,290 | $37,200 | $75,090 |
| 2016 | $6,143 | $103,680 | $34,350 | $69,330 |
| 2015 | $5,998 | $95,780 | $31,730 | $64,050 |
| 2014 | $5,540 | $83,190 | $30,800 | $52,390 |
| 2013 | $5,486 | $84,890 | $31,430 | $53,460 |
Source: Public Records
Map
Nearby Homes
- 1043 S York Rd Unit 209
- 1043 S York Rd Unit 208
- 1043 S York Rd Unit 411
- 1043 S York Rd Unit 605
- 909 N Addison Ave
- 3N425 N Howard Ave
- 3N276 N Howard Ave
- 841 N York St Unit 101
- 841 N York St Unit 129
- 128 David Dr
- 791 N Adele St
- 342 Diana Ct
- 1010 Judson St Unit 2B
- 1010 Judson St Unit 2A
- 311 George St
- 809 Brentwood Dr
- 634 N Kenilworth Ave
- 738 N Parker St
- 4N014 Church Rd
- 859 John St
- 15W683 Virginia Ln
- 15W663 Virginia Ln
- 15W707 Virginia Ln
- 15W674 Patricia Ln
- 15W655 Virginia Ln
- 15W668 Patricia Ln
- 15W704 Patricia Ln
- 15W713 Virginia Ln
- 15W654 Patricia Ln
- 150 E Grand Ave Unit 208
- 150 E Grand Ave Unit 207
- 150 E Grand Ave Unit 301
- 150 E Grand Ave Unit 307
- 150 E Grand Ave Unit 109
- 150 E Grand Ave Unit 308
- 150 E Grand Ave Unit 203
- 150 E Grand Ave Unit 101
- 150 E Grand Ave Unit 104
- 150 E Grand Ave Unit 205
- 150 E Grand Ave Unit 206