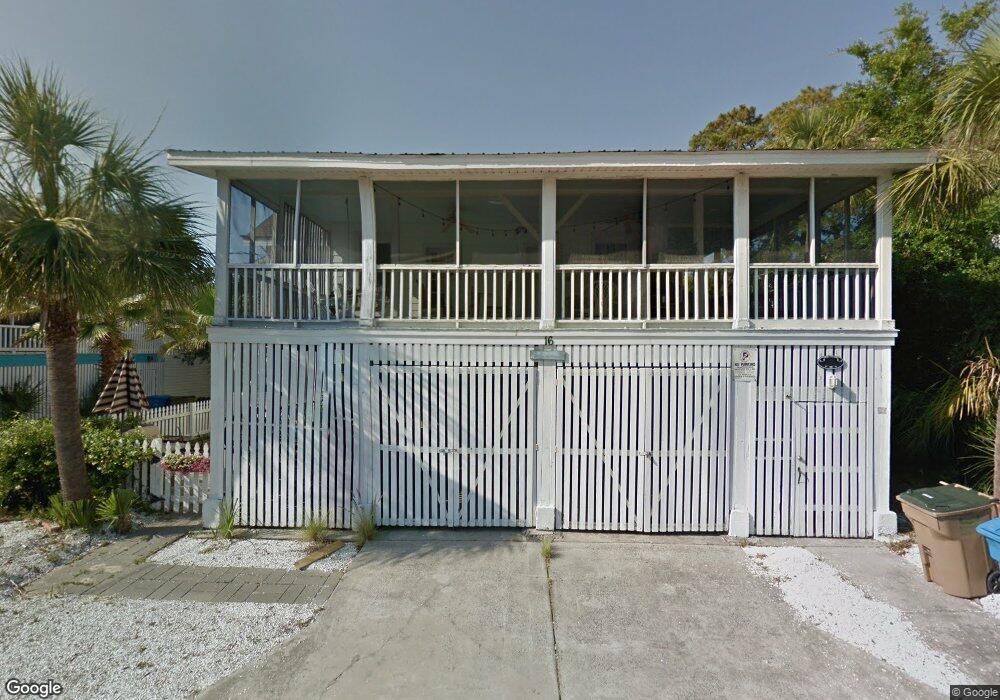
16 11th St Tybee Island, GA 31328
Estimated Value: $887,000 - $1,182,000
3
Beds
2
Baths
2,724
Sq Ft
$362/Sq Ft
Est. Value
About This Home
This home is located at 16 11th St, Tybee Island, GA 31328 and is currently estimated at $984,947, approximately $361 per square foot. 16 11th St is a home located in Chatham County with nearby schools including Howard Elementary School, Coastal Middle School, and Islands High School.
Ownership History
Date
Name
Owned For
Owner Type
Purchase Details
Closed on
Jun 28, 2024
Sold by
Sosimu Llc
Bought by
Mrsmadman Llc
Current Estimated Value
Purchase Details
Closed on
Mar 11, 2020
Sold by
Geriner Linda W
Bought by
Sosimu Llc
Purchase Details
Closed on
Dec 12, 2017
Sold by
Geriner William Henges
Bought by
Geriner Linda Wallace
Purchase Details
Closed on
Dec 7, 2007
Sold by
Not Provided
Bought by
Geriner William H
Purchase Details
Closed on
Aug 11, 2004
Sold by
Sheffield Jim A
Bought by
Jimallen Inc
Create a Home Valuation Report for This Property
The Home Valuation Report is an in-depth analysis detailing your home's value as well as a comparison with similar homes in the area
Home Values in the Area
Average Home Value in this Area
Purchase History
| Date | Buyer | Sale Price | Title Company |
|---|---|---|---|
| Mrsmadman Llc | -- | -- | |
| Sosimu Llc | -- | -- | |
| Geriner Linda Wallace | -- | -- | |
| Geriner William H | $900,000 | -- | |
| Jimallen Inc | -- | -- |
Source: Public Records
Tax History Compared to Growth
Tax History
| Year | Tax Paid | Tax Assessment Tax Assessment Total Assessment is a certain percentage of the fair market value that is determined by local assessors to be the total taxable value of land and additions on the property. | Land | Improvement |
|---|---|---|---|---|
| 2025 | $22,384 | $355,480 | $150,000 | $205,480 |
| 2024 | $22,384 | $354,840 | $150,000 | $204,840 |
| 2023 | $15,848 | $344,080 | $150,000 | $194,080 |
| 2022 | $8,095 | $308,240 | $150,000 | $158,240 |
| 2021 | $7,933 | $240,880 | $83,200 | $157,680 |
| 2020 | $8,598 | $250,240 | $76,800 | $173,440 |
| 2019 | $12,834 | $250,240 | $76,800 | $173,440 |
| 2018 | $7,059 | $246,680 | $76,800 | $169,880 |
| 2017 | $6,309 | $242,360 | $76,800 | $165,560 |
| 2016 | $6,308 | $195,800 | $76,800 | $119,000 |
| 2015 | $9,446 | $195,800 | $76,800 | $119,000 |
| 2014 | $7,735 | $195,800 | $0 | $0 |
Source: Public Records
Map
Nearby Homes