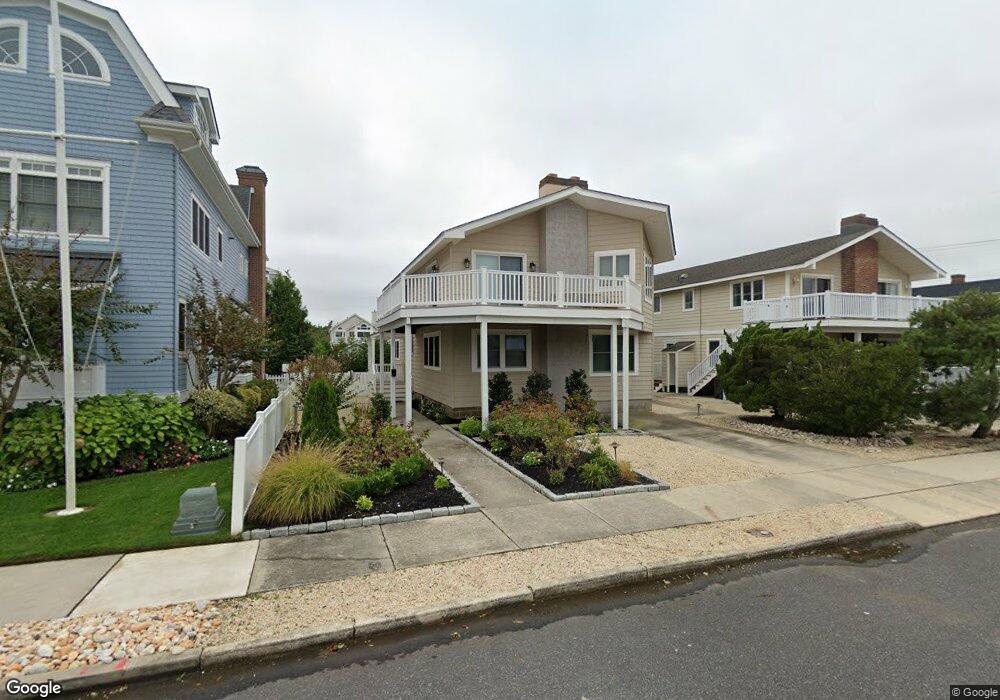
16 14th St E Avalon, NJ 08202
Estimated Value: $3,377,000 - $4,246,000
Studio
--
Bath
2,422
Sq Ft
$1,545/Sq Ft
Est. Value
About This Home
This home is located at 16 14th St E, Avalon, NJ 08202 and is currently estimated at $3,742,908, approximately $1,545 per square foot. 16 14th St E is a home located in Cape May County with nearby schools including Avalon Elementary School.
Ownership History
Date
Name
Owned For
Owner Type
Purchase Details
Closed on
Jan 22, 2025
Sold by
Brinkley Charles B and Brinkley Margaret Mary
Bought by
Charles And Margaret Mary Brinkley Living Tru and Brinkley
Current Estimated Value
Purchase Details
Closed on
Oct 10, 1981
Bought by
Brinkley Charles B and Brinkley Margaret M
Create a Home Valuation Report for This Property
The Home Valuation Report is an in-depth analysis detailing your home's value as well as a comparison with similar homes in the area
Home Values in the Area
Average Home Value in this Area
Purchase History
| Date | Buyer | Sale Price | Title Company |
|---|---|---|---|
| Charles And Margaret Mary Brinkley Living Tru | -- | None Listed On Document | |
| Charles And Margaret Mary Brinkley Living Tru | -- | None Listed On Document | |
| Brinkley Charles B | $260,000 | -- |
Source: Public Records
Tax History
| Year | Tax Paid | Tax Assessment Tax Assessment Total Assessment is a certain percentage of the fair market value that is determined by local assessors to be the total taxable value of land and additions on the property. | Land | Improvement |
|---|---|---|---|---|
| 2025 | $12,445 | $2,026,900 | $1,700,000 | $326,900 |
| 2024 | $12,445 | $2,026,900 | $1,700,000 | $326,900 |
Source: Public Records
Map
Nearby Homes
Your Personal Tour Guide
Ask me questions while you tour the home.