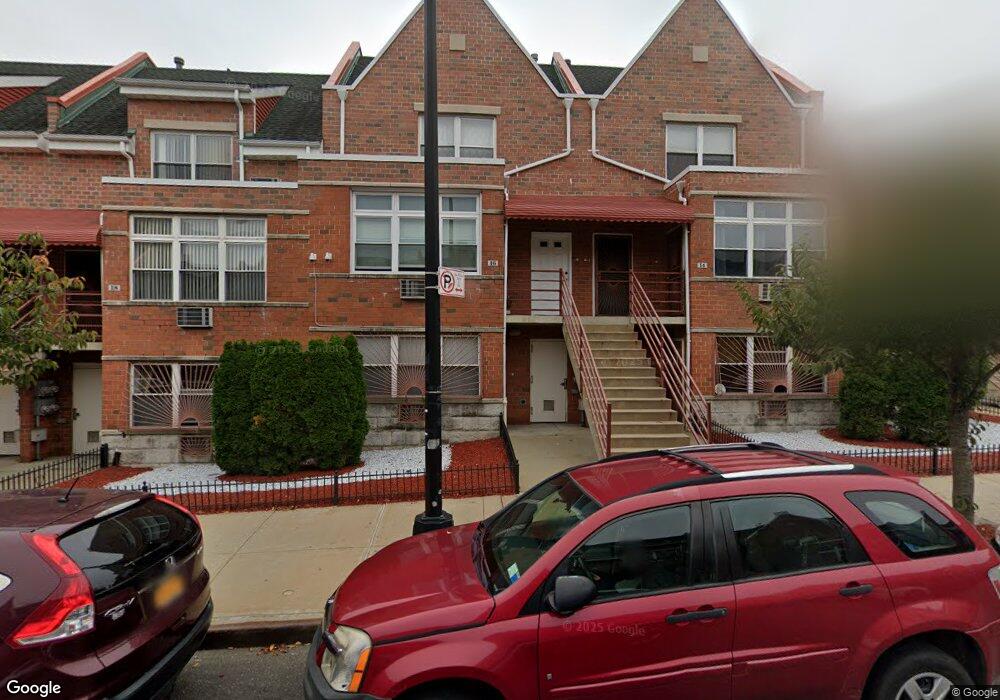
16-24 Renaissance Ct Unit 16A Brooklyn, NY 11206
Bushwick NeighborhoodEstimated Value: $696,000 - $1,026,000
--
Bed
--
Bath
941
Sq Ft
$882/Sq Ft
Est. Value
About This Home
This home is located at 16-24 Renaissance Ct Unit 16A, Brooklyn, NY 11206 and is currently estimated at $829,781, approximately $881 per square foot. 16-24 Renaissance Ct Unit 16A is a home located in Kings County with nearby schools including P.S. 145 Andrew Jackson, Bedford Stuyvesant New Beginnings Charter School, and Williamsburg Charter High School.
Create a Home Valuation Report for This Property
The Home Valuation Report is an in-depth analysis detailing your home's value as well as a comparison with similar homes in the area
Home Values in the Area
Average Home Value in this Area
Tax History Compared to Growth
Tax History
| Year | Tax Paid | Tax Assessment Tax Assessment Total Assessment is a certain percentage of the fair market value that is determined by local assessors to be the total taxable value of land and additions on the property. | Land | Improvement |
|---|---|---|---|---|
| 2025 | $3,655 | $29,323 | $2,117 | $27,206 |
| 2024 | $3,655 | $34,497 | $2,117 | $32,380 |
| 2023 | $3,242 | $42,325 | $2,117 | $40,208 |
| 2022 | $2,683 | $39,021 | $2,117 | $36,904 |
| 2021 | $1,946 | $35,657 | $2,117 | $33,540 |
| 2020 | $1,946 | $25,925 | $2,117 | $23,808 |
| 2019 | $1,162 | $22,543 | $2,117 | $20,426 |
| 2018 | $848 | $15,243 | $1,496 | $13,747 |
| 2017 | $579 | $15,128 | $1,602 | $13,526 |
| 2016 | $303 | $14,272 | $1,818 | $12,454 |
| 2015 | $36 | $13,465 | $1,870 | $11,595 |
| 2014 | $36 | $12,703 | $2,092 | $10,611 |
Source: Public Records
Map
Nearby Homes
- 6 Renaissance Ct Unit 6B
- 27 Stanwix St Unit 6B
- 21 Jefferson St
- 76 Beaver St
- 95 Jefferson St
- 16 Melrose St Unit 4F
- 168 Evergreen Ave Unit 3B
- 443 Bushwick Ave
- 695 Bushwick Ave
- 71 George St
- 815 Willoughby Ave
- 29 Fayette St
- 327 Vernon Ave
- 10 Suydam St
- 151 Noll St
- 557 Hart St Unit 3-A
- 107A Suydam St
- 427 Pulaski St
- 449 Pulaski St
- 115 George St
- 16-24 Renaissance Ct Unit 16C
- 16 Renaissance Ct Unit 24
- 16 Renaissance Ct Unit 24
- 18 Renaissance Ct Unit 24
- 18 Renaissance Ct Unit C
- 18-24 Renaissance Ct Unit 18B
- 12 Renaissance Ct Unit 12-B
- 6 Renaissance Ct Unit 8C
- 6 Renaissance Ct Unit 24
- 6 Renaissance Ct Unit 24
- 6 Renaissance Ct Unit 24
- 6 Renaissance Ct Unit 24
- 6 Renaissance Ct Unit 24
- 6 Renaissance Ct Unit 24
- 6 Renaissance Ct Unit 24
- 6 Renaissance Ct Unit 24
- 6 Renaissance Ct Unit 24
- 6 Renaissance Ct Unit 24
- 6 Renaissance Ct Unit 24