Estimated Value: $492,000 - $534,000
3
Beds
1
Bath
1,382
Sq Ft
$368/Sq Ft
Est. Value
About This Home
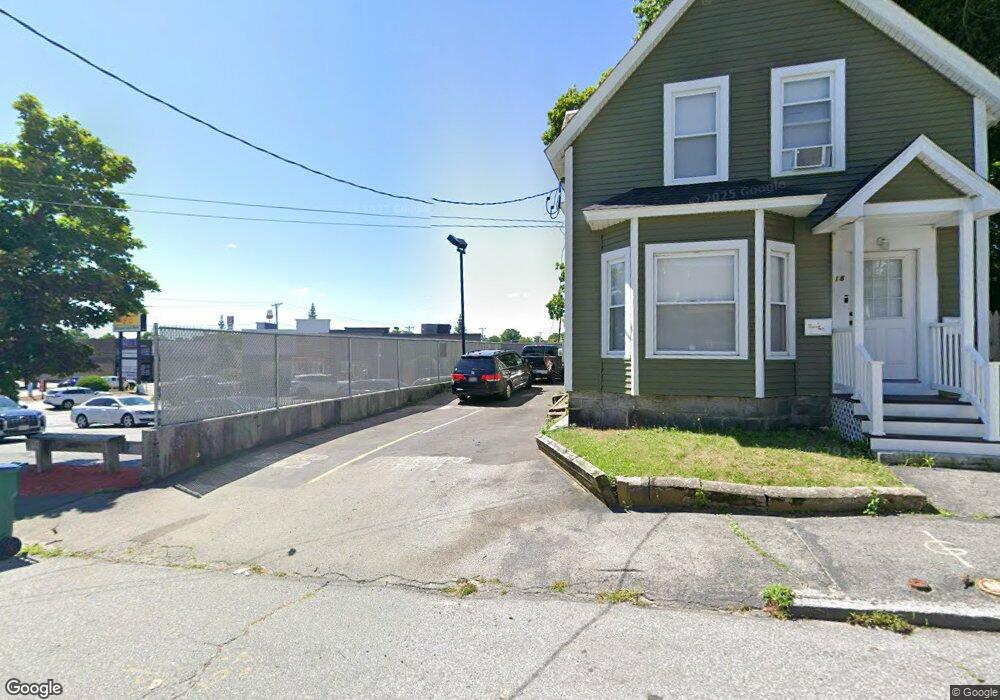
This home is located at 16 A St, Lowell, MA 01851 and is currently estimated at $508,485, approximately $367 per square foot. 16 A St is a home with nearby schools including Abraham Lincoln Elementary School, Charles W. Morey Elementary School, and Dr. Gertrude Bailey Elementary School.
Ownership History
Date
Name
Owned For
Owner Type
Purchase Details
Closed on
Jun 26, 2024
Sold by
Te Chheng L
Bought by
Chheng & Nary Te Ft and Te
Current Estimated Value
Purchase Details
Closed on
Apr 14, 2006
Sold by
Lewis Charlene D and Lewis Thomas W
Bought by
Ngaruiya Moses and Gitau Peninah
Home Financials for this Owner
Home Financials are based on the most recent Mortgage that was taken out on this home.
Original Mortgage
$204,675
Interest Rate
6.28%
Mortgage Type
Purchase Money Mortgage
Create a Home Valuation Report for This Property
The Home Valuation Report is an in-depth analysis detailing your home's value as well as a comparison with similar homes in the area
Home Values in the Area
Average Home Value in this Area
Purchase History
| Date | Buyer | Sale Price | Title Company |
|---|---|---|---|
| Chheng & Nary Te Ft | -- | None Available | |
| Ngaruiya Moses | $272,900 | -- | |
| Ngaruiya Moses | $272,900 | -- |
Source: Public Records
Mortgage History
| Date | Status | Borrower | Loan Amount |
|---|---|---|---|
| Previous Owner | Ngaruiya Moses | $204,675 |
Source: Public Records
Tax History
| Year | Tax Paid | Tax Assessment Tax Assessment Total Assessment is a certain percentage of the fair market value that is determined by local assessors to be the total taxable value of land and additions on the property. | Land | Improvement |
|---|---|---|---|---|
| 2025 | $5,269 | $459,000 | $133,800 | $325,200 |
| 2024 | $4,951 | $415,700 | $125,100 | $290,600 |
| 2023 | $4,753 | $382,700 | $108,800 | $273,900 |
| 2022 | $4,345 | $342,400 | $98,900 | $243,500 |
| 2021 | $4,248 | $315,600 | $86,000 | $229,600 |
| 2020 | $4,127 | $308,900 | $100,300 | $208,600 |
| 2019 | $4,065 | $289,500 | $85,800 | $203,700 |
| 2018 | $3,418 | $249,000 | $80,100 | $168,900 |
| 2017 | $3,361 | $225,300 | $65,900 | $159,400 |
| 2016 | $3,140 | $207,100 | $60,600 | $146,500 |
Source: Public Records
Map
Nearby Homes
- 186 Powell St
- 525 Chelmsford St
- 85 B St
- 710 School St
- 28 Liberty St
- 18 Burgess St
- 15 Barclay St
- 108 Inland St
- 84 Cambridge St
- 6 Cottage Place
- 81-83 Canada St
- 255 Plain St
- 11 Warwick St Unit 3
- 68 Smith St
- 131 London St
- 137 Pine St Unit 11
- 490 School St Unit 2
- 3 Butman Place
- 42 Branch St
- 45 Marshall St
Your Personal Tour Guide
Ask me questions while you tour the home.