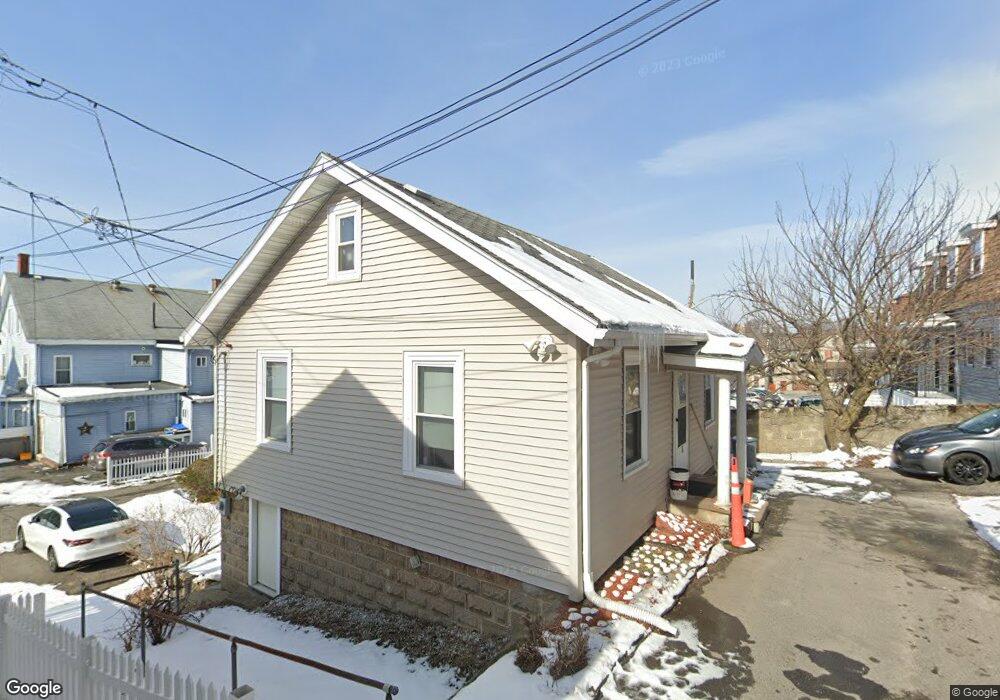
16 Acorn Ct Malden, MA 02148
Belmont NeighborhoodEstimated Value: $452,000 - $541,000
1
Bed
2
Baths
672
Sq Ft
$732/Sq Ft
Est. Value
About This Home
This home is located at 16 Acorn Ct, Malden, MA 02148 and is currently estimated at $491,905, approximately $732 per square foot. 16 Acorn Ct is a home located in Middlesex County with nearby schools including Malden High School, Cheverus Catholic School, and St Anthony School.
Ownership History
Date
Name
Owned For
Owner Type
Purchase Details
Closed on
Feb 16, 1999
Sold by
Nilsson Muriel
Bought by
White Christopher
Current Estimated Value
Home Financials for this Owner
Home Financials are based on the most recent Mortgage that was taken out on this home.
Original Mortgage
$85,000
Outstanding Balance
$20,188
Interest Rate
6.78%
Mortgage Type
Purchase Money Mortgage
Estimated Equity
$471,717
Purchase Details
Closed on
Aug 30, 1991
Sold by
First Atlantic Prop
Bought by
White Christopher
Home Financials for this Owner
Home Financials are based on the most recent Mortgage that was taken out on this home.
Original Mortgage
$275,000
Interest Rate
9.44%
Mortgage Type
Purchase Money Mortgage
Create a Home Valuation Report for This Property
The Home Valuation Report is an in-depth analysis detailing your home's value as well as a comparison with similar homes in the area
Home Values in the Area
Average Home Value in this Area
Purchase History
| Date | Buyer | Sale Price | Title Company |
|---|---|---|---|
| White Christopher | $85,000 | -- | |
| White Christopher | $222,000 | -- |
Source: Public Records
Mortgage History
| Date | Status | Borrower | Loan Amount |
|---|---|---|---|
| Open | White Christopher | $85,000 | |
| Previous Owner | White Christopher | $275,000 |
Source: Public Records
Tax History Compared to Growth
Tax History
| Year | Tax Paid | Tax Assessment Tax Assessment Total Assessment is a certain percentage of the fair market value that is determined by local assessors to be the total taxable value of land and additions on the property. | Land | Improvement |
|---|---|---|---|---|
| 2025 | $45 | $393,600 | $222,500 | $171,100 |
| 2024 | $4,280 | $366,100 | $210,500 | $155,600 |
| 2023 | $4,087 | $335,300 | $192,400 | $142,900 |
| 2022 | $3,872 | $313,500 | $174,400 | $139,100 |
| 2021 | $3,645 | $296,600 | $159,300 | $137,300 |
| 2020 | $3,614 | $285,700 | $151,500 | $134,200 |
| 2019 | $3,583 | $270,000 | $144,300 | $125,700 |
| 2018 | $3,421 | $242,800 | $121,800 | $121,000 |
| 2017 | $3,268 | $230,600 | $121,800 | $108,800 |
| 2016 | $3,234 | $213,300 | $115,800 | $97,500 |
| 2015 | $3,146 | $200,000 | $109,100 | $90,900 |
| 2014 | $2,954 | $183,500 | $99,200 | $84,300 |
Source: Public Records
Map
Nearby Homes
- 80 Main St Unit 9
- 4 Cross St Unit 1
- 55 Clarendon St
- 89 Judson St
- 67 Converse Ave Unit 69
- 58 Regent Rd
- 100 Medford St
- 16 Woodville St
- 17 Garland Ave
- 210 Hancock St
- 171 Bell Rock St Unit 171
- 340 Main St
- 74 Madison St
- 39 Kinsman St
- 315 Main St
- 81 Everett St
- 13-15 Benner Ave
- 16 Boylston St
- 32 Central Ave
- 21 Central Ave Unit 10