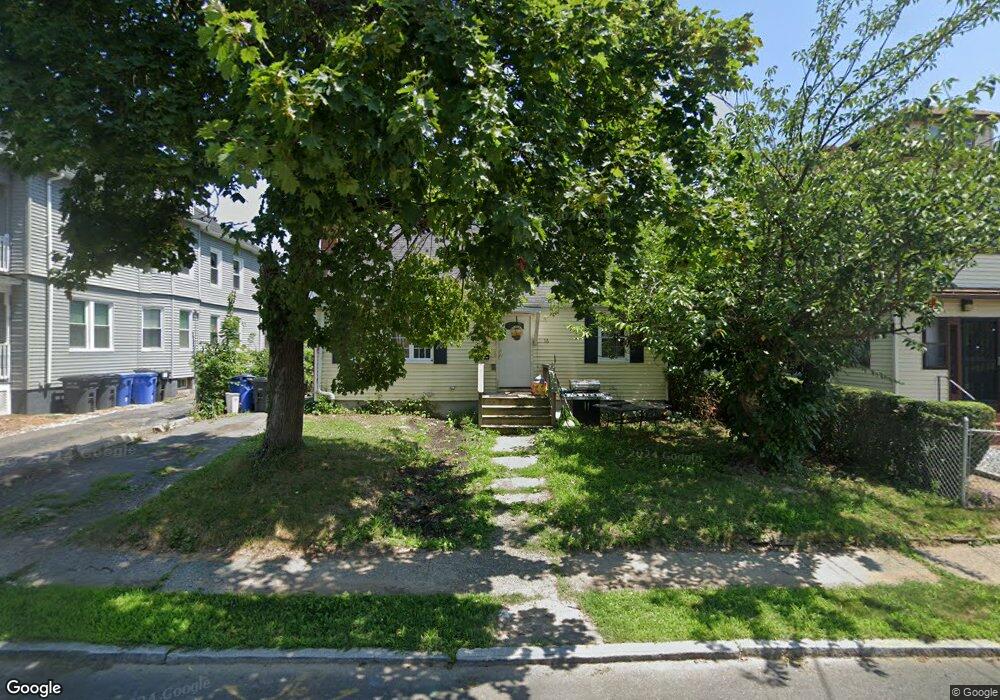
16 Adams St Hartford, CT 06112
Upper Albany NeighborhoodEstimated Value: $169,000 - $282,000
4
Beds
1
Bath
1,075
Sq Ft
$218/Sq Ft
Est. Value
About This Home
This home is located at 16 Adams St, Hartford, CT 06112 and is currently estimated at $234,836, approximately $218 per square foot. 16 Adams St is a home located in Hartford County with nearby schools including Rawson School, Noah Webster Micro Society School, and McKinley School.
Ownership History
Date
Name
Owned For
Owner Type
Purchase Details
Closed on
Jun 1, 2011
Sold by
Kelly George
Bought by
Trice Adrian
Current Estimated Value
Home Financials for this Owner
Home Financials are based on the most recent Mortgage that was taken out on this home.
Original Mortgage
$105,262
Outstanding Balance
$73,051
Interest Rate
4.85%
Mortgage Type
Purchase Money Mortgage
Estimated Equity
$161,785
Purchase Details
Closed on
Oct 25, 2010
Sold by
Hsbc Bank Usa
Bought by
Kelly George
Purchase Details
Closed on
Jan 20, 2010
Sold by
Wallace Candace
Bought by
Hsbc Bank Usa
Purchase Details
Closed on
Nov 23, 2005
Sold by
Clue Milton
Bought by
Wallace Candace
Purchase Details
Closed on
Mar 4, 2005
Sold by
Hume Carlton
Bought by
Clue Milton
Purchase Details
Closed on
May 31, 1990
Sold by
Rosenberg Franklin
Bought by
Jacobs Robyn
Purchase Details
Closed on
Sep 4, 1987
Sold by
Wilsoniian Funding
Bought by
Hume Carlton L
Create a Home Valuation Report for This Property
The Home Valuation Report is an in-depth analysis detailing your home's value as well as a comparison with similar homes in the area
Home Values in the Area
Average Home Value in this Area
Purchase History
| Date | Buyer | Sale Price | Title Company |
|---|---|---|---|
| Trice Adrian | $108,000 | -- | |
| Kelly George | $38,000 | -- | |
| Hsbc Bank Usa | -- | -- | |
| Wallace Candace | $155,000 | -- | |
| Clue Milton | $68,000 | -- | |
| Jacobs Robyn | $290,000 | -- | |
| Hume Carlton L | $56,000 | -- |
Source: Public Records
Mortgage History
| Date | Status | Borrower | Loan Amount |
|---|---|---|---|
| Open | Hume Carlton L | $30,920 | |
| Open | Hume Carlton L | $105,262 |
Source: Public Records
Tax History Compared to Growth
Tax History
| Year | Tax Paid | Tax Assessment Tax Assessment Total Assessment is a certain percentage of the fair market value that is determined by local assessors to be the total taxable value of land and additions on the property. | Land | Improvement |
|---|---|---|---|---|
| 2025 | $3,588 | $52,038 | $5,660 | $46,378 |
| 2024 | $3,588 | $52,038 | $5,660 | $46,378 |
| 2023 | $3,588 | $52,038 | $5,660 | $46,378 |
| 2022 | $3,588 | $52,039 | $5,660 | $46,379 |
| 2021 | $3,042 | $40,950 | $6,685 | $34,265 |
| 2020 | $3,042 | $40,950 | $6,685 | $34,265 |
| 2019 | $3,042 | $40,950 | $6,685 | $34,265 |
| 2018 | $2,940 | $39,569 | $6,459 | $33,110 |
| 2016 | $2,826 | $38,040 | $6,152 | $31,888 |
| 2015 | $2,692 | $36,233 | $5,860 | $30,373 |
| 2014 | $2,626 | $35,347 | $5,716 | $29,631 |
Source: Public Records
Map
Nearby Homes
- 364 Woodland St
- 131-135,137-145,119- Albany Ave
- 103 Baltimore St
- 138 Kent St Unit 140
- 8 Sterling St
- 290 Sargeant St Unit 292
- 68 Sterling St Unit 70
- 4 Deerfield Ave
- 109 Blue Hills Ave
- 78-80 Cabot St
- 240 Sargeant St
- 111 Westbourne Pkwy Unit 113
- 175 Scarborough St
- 52 Atwood St Unit 3B
- 25 Cornwall St
- 141 Greenfield St
- 25 May St
- 275 Kenyon St
- 62 Burton St
- 10 Burton St Unit 12
- 18 Adams St Unit 20
- 22 Adams St Unit 24
- 10 Adams St Unit 12
- 21 Adams St Unit 23
- 19 Milford St Unit 21
- 23 Milford St Unit 25
- 640 Milford St
- 15 Milford St Unit 17
- 9 Adams St Unit 11
- 26 Adams St Unit 28
- 15 Adams St Unit 17
- 27 Milford St Unit 29
- 29 Adams St Unit 31
- 31 Milford St Unit 33
- 25 Adams St Unit 27
- 30 Adams St Unit 32
- 18 Milford St Unit 20
- 14 Milford St Unit 16
- 34 Adams St Unit 36
- 35 Milford St Unit 37