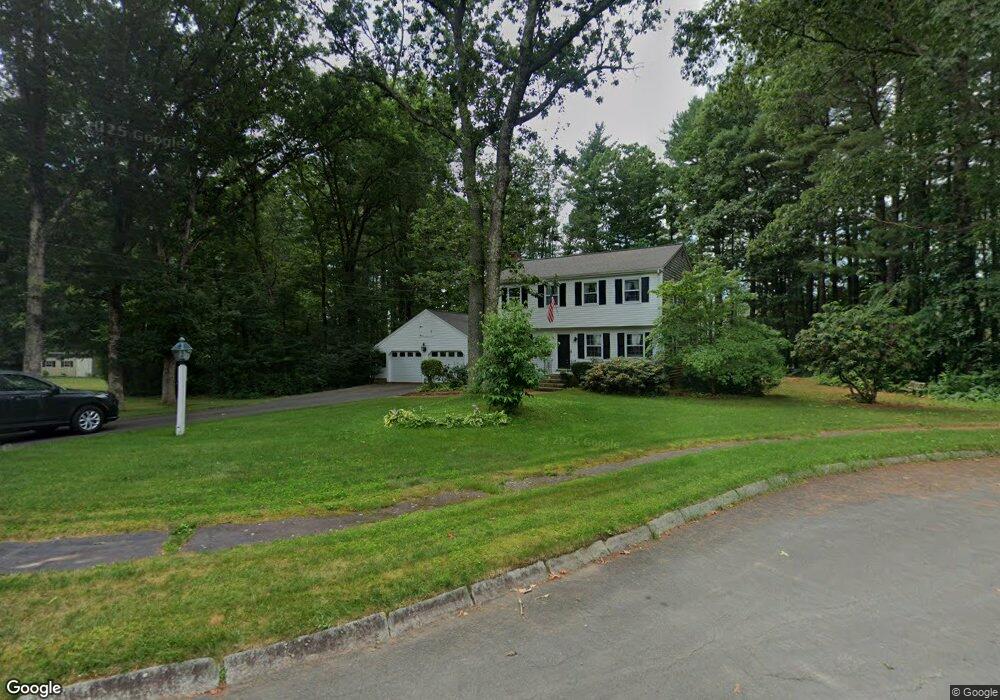
16 Alexander Rd Foxboro, MA 02035
Estimated Value: $659,265 - $778,000
4
Beds
2
Baths
1,696
Sq Ft
$423/Sq Ft
Est. Value
About This Home
This home is located at 16 Alexander Rd, Foxboro, MA 02035 and is currently estimated at $716,566, approximately $422 per square foot. 16 Alexander Rd is a home located in Norfolk County with nearby schools including Foxborough High School, Foxborough Regional Charter School, and Hands-On-Montessori School.
Ownership History
Date
Name
Owned For
Owner Type
Purchase Details
Closed on
Sep 7, 2023
Sold by
Burns David J and Burns Lynn S
Bought by
Burns-Foxboro Rt and Burns
Current Estimated Value
Purchase Details
Closed on
Jun 17, 1994
Sold by
Alexander Rt
Bought by
Burns David J and Burns Lynn S
Home Financials for this Owner
Home Financials are based on the most recent Mortgage that was taken out on this home.
Original Mortgage
$158,000
Interest Rate
8.5%
Mortgage Type
Purchase Money Mortgage
Create a Home Valuation Report for This Property
The Home Valuation Report is an in-depth analysis detailing your home's value as well as a comparison with similar homes in the area
Home Values in the Area
Average Home Value in this Area
Purchase History
| Date | Buyer | Sale Price | Title Company |
|---|---|---|---|
| Burns-Foxboro Rt | -- | None Available | |
| Burns David J | $192,000 | -- |
Source: Public Records
Mortgage History
| Date | Status | Borrower | Loan Amount |
|---|---|---|---|
| Previous Owner | Burns David J | $158,000 |
Source: Public Records
Tax History Compared to Growth
Tax History
| Year | Tax Paid | Tax Assessment Tax Assessment Total Assessment is a certain percentage of the fair market value that is determined by local assessors to be the total taxable value of land and additions on the property. | Land | Improvement |
|---|---|---|---|---|
| 2025 | $7,025 | $531,400 | $243,900 | $287,500 |
| 2024 | $7,045 | $521,500 | $243,900 | $277,600 |
| 2023 | $6,835 | $481,000 | $232,300 | $248,700 |
| 2022 | $6,643 | $457,500 | $222,200 | $235,300 |
| 2021 | $6,388 | $433,400 | $202,000 | $231,400 |
| 2020 | $6,202 | $425,700 | $202,000 | $223,700 |
| 2019 | $5,964 | $405,700 | $192,400 | $213,300 |
| 2018 | $5,965 | $409,400 | $192,400 | $217,000 |
| 2017 | $5,751 | $382,400 | $179,800 | $202,600 |
| 2016 | $5,568 | $375,700 | $173,100 | $202,600 |
| 2015 | $5,455 | $359,100 | $146,200 | $212,900 |
| 2014 | $5,278 | $352,100 | $143,300 | $208,800 |
Source: Public Records
Map
Nearby Homes
- 67 Morse St
- 12 Community Way
- 9 Independence Dr Unit 9
- 35 Independence Dr Unit 35
- 5 Lauren Ln
- 132 Cannon Forge Dr
- 170 Cannon Forge Dr
- 261 East St
- 18 Winter St Unit E
- 11 W Belcher Rd Unit 5
- 619 N Main St
- 60 King St
- 44 Angell St Unit 44
- 28 Angell St
- 84 Cocasset St Unit A6
- 19 Fuller Rd Unit 7
- 89 Oak St
- 356 Central St
- 25 Winter St
- 82 Brook St