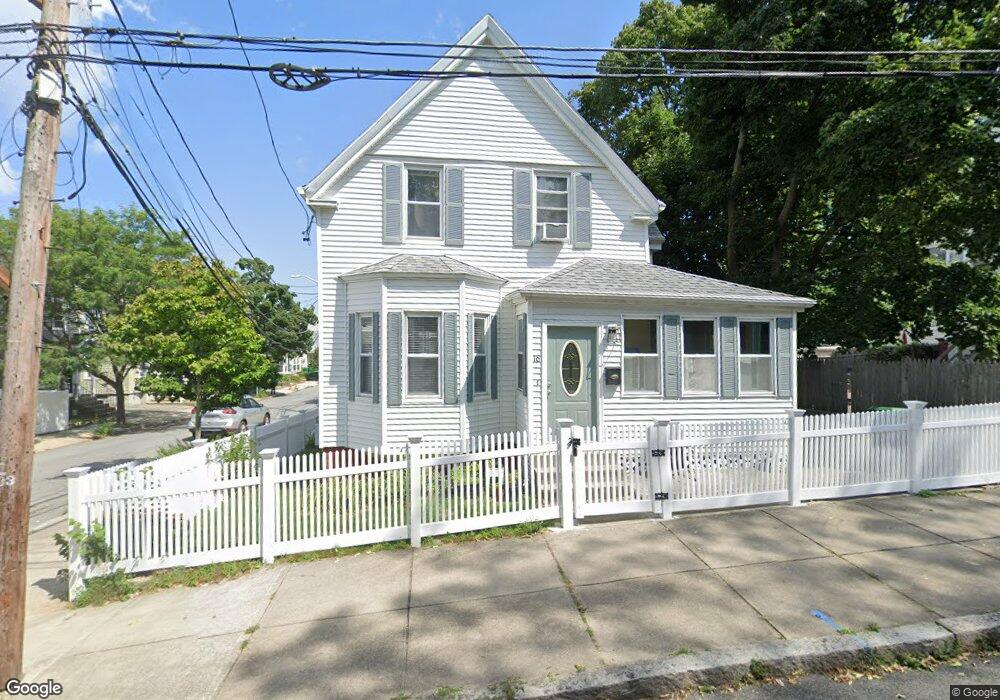
16 Alfred St Medford, MA 02155
South Medford NeighborhoodEstimated Value: $695,000 - $838,000
3
Beds
4
Baths
978
Sq Ft
$781/Sq Ft
Est. Value
About This Home
This home is located at 16 Alfred St, Medford, MA 02155 and is currently estimated at $763,800, approximately $780 per square foot. 16 Alfred St is a home located in Middlesex County with nearby schools including Medford High School and St. Clement Elementary School.
Ownership History
Date
Name
Owned For
Owner Type
Purchase Details
Closed on
Oct 27, 2004
Sold by
Kumar Ravinder
Bought by
Swan Jeffrey
Current Estimated Value
Home Financials for this Owner
Home Financials are based on the most recent Mortgage that was taken out on this home.
Original Mortgage
$257,250
Interest Rate
5.74%
Mortgage Type
Purchase Money Mortgage
Purchase Details
Closed on
Dec 13, 1991
Sold by
Deady Carol R
Bought by
Kumar Ravinder and Sharma Davinder
Create a Home Valuation Report for This Property
The Home Valuation Report is an in-depth analysis detailing your home's value as well as a comparison with similar homes in the area
Home Values in the Area
Average Home Value in this Area
Purchase History
| Date | Buyer | Sale Price | Title Company |
|---|---|---|---|
| Swan Jeffrey | $343,000 | -- | |
| Kumar Ravinder | $93,000 | -- |
Source: Public Records
Mortgage History
| Date | Status | Borrower | Loan Amount |
|---|---|---|---|
| Open | Kumar Ravinder | $240,380 | |
| Closed | Kumar Ravinder | $284,289 | |
| Closed | Swan Jeffrey | $257,250 |
Source: Public Records
Tax History Compared to Growth
Tax History
| Year | Tax Paid | Tax Assessment Tax Assessment Total Assessment is a certain percentage of the fair market value that is determined by local assessors to be the total taxable value of land and additions on the property. | Land | Improvement |
|---|---|---|---|---|
| 2025 | $4,593 | $539,100 | $279,100 | $260,000 |
| 2024 | $4,593 | $539,100 | $279,100 | $260,000 |
| 2023 | $4,423 | $511,300 | $260,800 | $250,500 |
| 2022 | $4,127 | $458,000 | $237,100 | $220,900 |
| 2021 | $4,105 | $436,200 | $225,800 | $210,400 |
| 2020 | $4,039 | $440,000 | $225,800 | $214,200 |
| 2019 | $3,890 | $405,200 | $205,300 | $199,900 |
| 2018 | $3,664 | $357,800 | $186,600 | $171,200 |
| 2017 | $3,471 | $328,700 | $174,400 | $154,300 |
| 2016 | $3,346 | $299,000 | $158,600 | $140,400 |
| 2015 | $3,262 | $278,800 | $151,000 | $127,800 |
Source: Public Records
Map
Nearby Homes
- 595 Broadway Unit 202
- 595 Broadway Unit 302
- 595 Broadway Unit 101
- 11 Albion St
- 501 Main St
- 87 Medford St Unit 504
- 87 Medford St Unit 305
- 519 Broadway Unit 302
- 11 Bonner Ave Unit 2
- 11 Bonner Ave Unit 1
- 31 Wareham St
- 39 Bonner Ave Unit PH
- 67 Boston Ave Unit 67
- 69 Boston Ave
- 34 Fiske Ave Unit B
- 34 Fiske Ave Unit A
- 34 Fiske Ave Unit C
- 10 Roberts St Unit 14
- 57 Edward St
- 60 Pearson Ave Unit 60
- 36 Clayton Ave
- 34 Clayton Ave
- 65 Albion St
- 63 Albion St
- 32 Clayton Ave
- 61 Albion St
- 39 Clayton Ave
- 9999 Clayton Ave
- 35 Clayton Ave
- 30 Clayton Ave
- 30 Clayton Ave Unit 1
- 30 Clayton Ave Unit 2
- 57 Albion St
- 57 Albion St Unit 1
- 33 Clayton Ave
- 33 Clayton Ave
- 33 Clayton Ave Unit 1
- 71 Albion St
- 31 Clayton Ave
- 53 Albion St