Estimated Value: $923,000 - $970,000
4
Beds
2
Baths
2,312
Sq Ft
$412/Sq Ft
Est. Value
About This Home
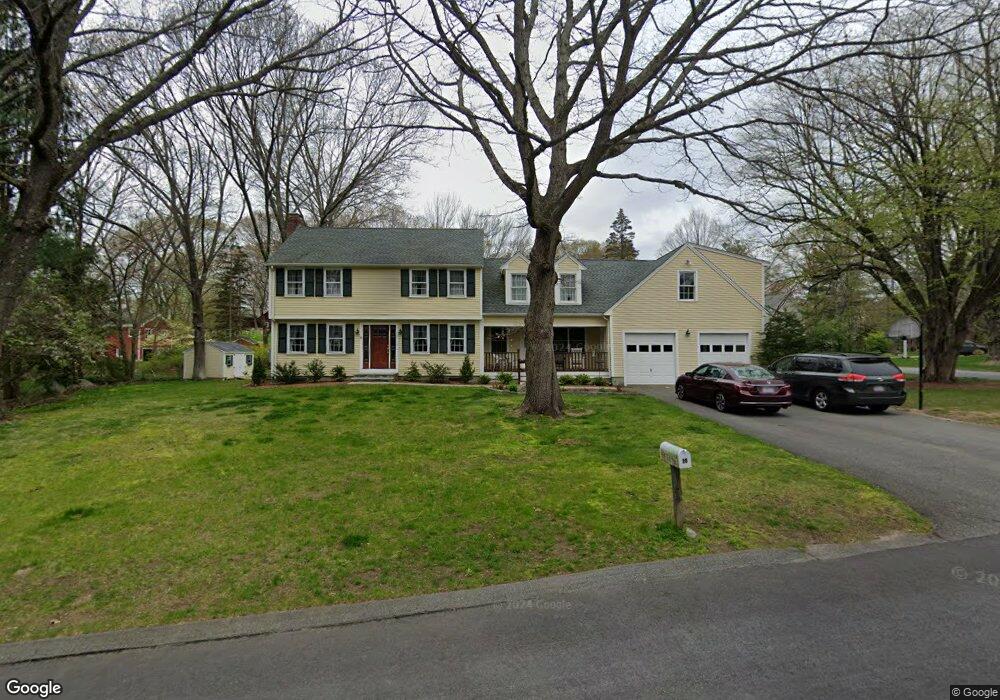
This home is located at 16 Algonquin Rd, Acton, MA 01720 and is currently estimated at $951,966, approximately $411 per square foot. 16 Algonquin Rd is a home located in Middlesex County with nearby schools including Acton-Boxborough Regional High School and Oak Meadow Montessori School.
Ownership History
Date
Name
Owned For
Owner Type
Purchase Details
Closed on
Apr 21, 2021
Sold by
Cipar John J and Martyak Mary T
Bought by
Martyak Cipar Ft
Current Estimated Value
Purchase Details
Closed on
May 11, 1987
Sold by
Crowley Theodore R
Bought by
Cipar John J
Create a Home Valuation Report for This Property
The Home Valuation Report is an in-depth analysis detailing your home's value as well as a comparison with similar homes in the area
Home Values in the Area
Average Home Value in this Area
Purchase History
| Date | Buyer | Sale Price | Title Company |
|---|---|---|---|
| Martyak Cipar Ft | -- | None Available | |
| Cipar John J | $216,500 | -- |
Source: Public Records
Mortgage History
| Date | Status | Borrower | Loan Amount |
|---|---|---|---|
| Previous Owner | Cipar John J | $110,000 | |
| Previous Owner | Cipar John J | $50,000 |
Source: Public Records
Tax History
| Year | Tax Paid | Tax Assessment Tax Assessment Total Assessment is a certain percentage of the fair market value that is determined by local assessors to be the total taxable value of land and additions on the property. | Land | Improvement |
|---|---|---|---|---|
| 2025 | $15,788 | $920,600 | $314,400 | $606,200 |
| 2024 | $14,668 | $879,900 | $314,400 | $565,500 |
| 2023 | $14,322 | $815,600 | $286,000 | $529,600 |
| 2022 | $13,506 | $694,400 | $248,400 | $446,000 |
| 2021 | $13,190 | $652,000 | $230,000 | $422,000 |
| 2020 | $12,431 | $646,100 | $230,000 | $416,100 |
| 2019 | $11,920 | $615,400 | $230,000 | $385,400 |
| 2018 | $10,395 | $536,400 | $230,000 | $306,400 |
| 2017 | $10,128 | $531,400 | $230,000 | $301,400 |
| 2016 | $9,927 | $516,200 | $230,000 | $286,200 |
| 2015 | $9,736 | $511,100 | $230,000 | $281,100 |
| 2014 | $9,400 | $483,300 | $230,000 | $253,300 |
Source: Public Records
Map
Nearby Homes
- 60 Nashoba Rd
- 4 Littlefield Rd
- 5 Perkins Ln
- 79 Charter Rd
- 20 Joseph Reed Ln
- 4 Omega Way
- 235 Arlington St
- 285 Central St Unit 285
- 18 Hayward Rd
- 11 Braebrook
- 246 Main St Unit 2
- 33 Meadowbrook Rd
- 7 Kelley Rd
- 92 Willow St Unit 3
- 92 Willow St Unit 2
- 90 Willow St Unit 1
- 305 Harwood Ave
- 46 Taylor Rd
- 491 Main St
- 524 Main St
Your Personal Tour Guide
Ask me questions while you tour the home.