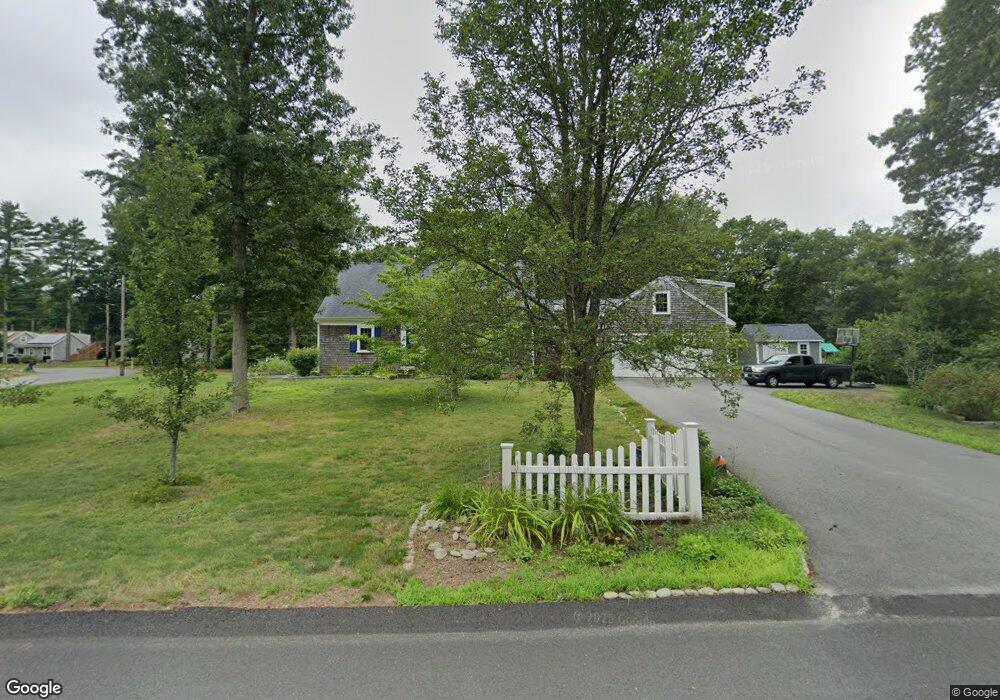
16 Allen St East Freetown, MA 02717
Estimated Value: $596,000 - $677,000
3
Beds
2
Baths
2,353
Sq Ft
$268/Sq Ft
Est. Value
About This Home
This home is located at 16 Allen St, East Freetown, MA 02717 and is currently estimated at $630,919, approximately $268 per square foot. 16 Allen St is a home located in Bristol County with nearby schools including Freetown Elementary School, George R Austin Intermediate School, and Freetown-Lakeville Middle School.
Ownership History
Date
Name
Owned For
Owner Type
Purchase Details
Closed on
Apr 3, 2023
Sold by
Poitras Ronald D and Poitras Lynne J
Bought by
Poitras Irt
Current Estimated Value
Purchase Details
Closed on
Nov 18, 1996
Sold by
Manning Christine M
Bought by
Poitras Ronald D and Poitras Lynne J
Purchase Details
Closed on
Aug 13, 1992
Sold by
Manning Robert J and Manning Christine
Bought by
Manning Christine M
Create a Home Valuation Report for This Property
The Home Valuation Report is an in-depth analysis detailing your home's value as well as a comparison with similar homes in the area
Home Values in the Area
Average Home Value in this Area
Purchase History
| Date | Buyer | Sale Price | Title Company |
|---|---|---|---|
| Poitras Irt | -- | None Available | |
| Poitras Ronald D | $148,000 | -- | |
| Manning Christine M | $50,000 | -- |
Source: Public Records
Mortgage History
| Date | Status | Borrower | Loan Amount |
|---|---|---|---|
| Previous Owner | Manning Christine M | $25,000 | |
| Previous Owner | Manning Christine M | $100,000 | |
| Previous Owner | Manning Christine M | $130,000 |
Source: Public Records
Tax History Compared to Growth
Tax History
| Year | Tax Paid | Tax Assessment Tax Assessment Total Assessment is a certain percentage of the fair market value that is determined by local assessors to be the total taxable value of land and additions on the property. | Land | Improvement |
|---|---|---|---|---|
| 2025 | $5,382 | $543,100 | $176,800 | $366,300 |
| 2024 | $5,347 | $512,700 | $166,800 | $345,900 |
| 2023 | $5,253 | $490,500 | $150,200 | $340,300 |
| 2022 | $5,005 | $415,000 | $127,200 | $287,800 |
| 2021 | $3,282 | $370,500 | $115,700 | $254,800 |
| 2020 | $4,673 | $358,900 | $111,300 | $247,600 |
| 2019 | $4,408 | $335,200 | $105,900 | $229,300 |
| 2018 | $3,108 | $313,900 | $105,900 | $208,000 |
| 2017 | $4,053 | $304,300 | $105,900 | $198,400 |
| 2016 | $3,869 | $295,600 | $102,900 | $192,700 |
| 2015 | $3,798 | $294,400 | $102,900 | $191,500 |
| 2014 | $3,638 | $288,500 | $100,800 | $187,700 |
Source: Public Records
Map
Nearby Homes
- 3 Abraham Ave
- 247 Braley Hill Rd
- 269 Middleboro Rd
- 28 Cedar Hill Dr
- 9 Paul Ave
- 120 Hackett Ave
- 60 Lakeside Ave
- 714 Snipatuit Rd
- 21 Bennett Rd
- 168 Keene Rd
- 199 Quaker Ln
- 4597 Acushnet Ave
- 0 Keene Rd Unit 73459818
- 15 Morrison Way
- 562 North Ave
- 0 Costa Dr
- 319 Northwest St
- 5 Freetown St
- 7 2nd Ave
- 14 2nd Ave