16 Allison Ct Riverside, RI 02915
Riverside NeighborhoodEstimated Value: $454,000 - $651,000
About This Home
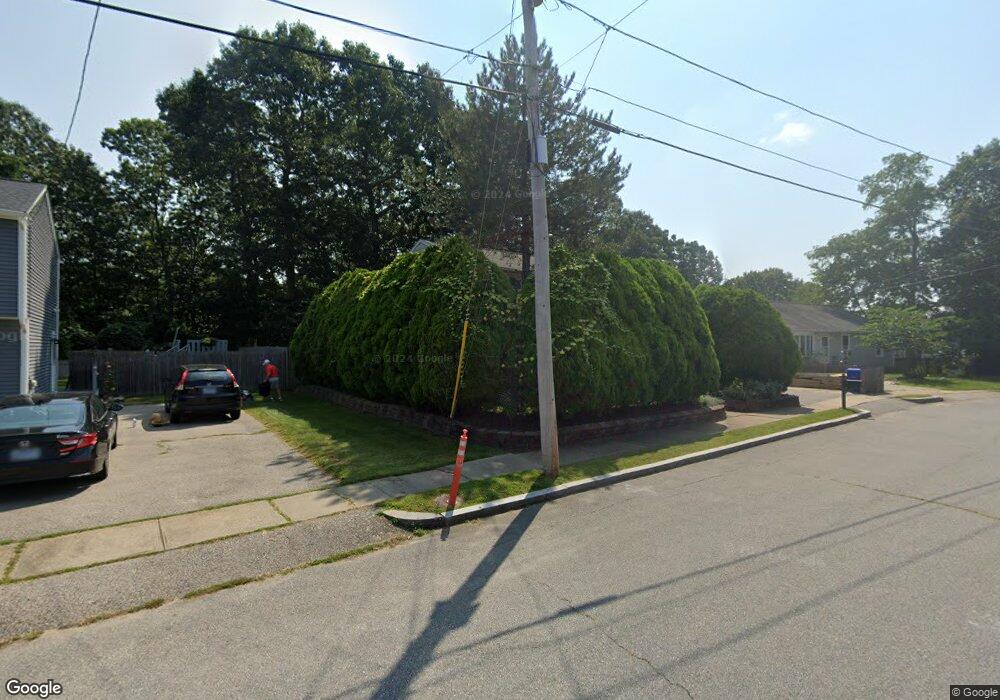
This home is located at 16 Allison Ct, Riverside, RI 02915 and is currently estimated at $515,610, approximately $322 per square foot. 16 Allison Ct is a home located in Providence County with nearby schools including East Providence High School, St Luke Elementary School, and Barrington Christian Academy.
Ownership History
We collect this data history from publicly available records. To have your information removed, we recommend requesting removal directly through your county’s website.
Purchase Details
Home Financials for this Owner
Home Financials are based on the most recent Mortgage that was taken out on this home.Home Values in the Area
Average Home Value in this Area
Purchase History
We collect this data history from publicly available records. To have your information removed, we recommend requesting removal directly through your county’s website.
| Date | Buyer | Sale Price | Title Company |
|---|---|---|---|
| $202,000 | -- | ||
| $202,000 | -- |
Mortgage History
We collect this data history from publicly available records. To have your information removed, we recommend requesting removal directly through your county’s website.
| Date | Status | Borrower | Loan Amount |
|---|---|---|---|
| Open | $198,341 | ||
| Closed | $198,341 | ||
| Previous Owner | $2,043 |
Tax History
We collect this data history from publicly available records. To have your information removed, we recommend requesting removal directly through your county’s website.
| Year | Tax Paid | Tax Assessment Tax Assessment Total Assessment is a certain percentage of the fair market value that is determined by local assessors to be the total taxable value of land and additions on the property. | Land | Improvement |
|---|---|---|---|---|
| 2025 | $5,831 | $446,100 | $128,400 | $317,700 |
| 2024 | $5,637 | $367,700 | $107,000 | $260,700 |
| 2023 | $5,427 | $367,700 | $107,000 | $260,700 |
| 2022 | $6,086 | $278,400 | $59,400 | $219,000 |
| 2021 | $5,986 | $278,400 | $57,400 | $221,000 |
| 2020 | $5,732 | $278,400 | $57,400 | $221,000 |
| 2019 | $5,574 | $278,400 | $57,400 | $221,000 |
| 2018 | $5,576 | $243,700 | $55,800 | $187,900 |
| 2017 | $5,452 | $243,700 | $55,800 | $187,900 |
| 2016 | $5,425 | $243,700 | $55,800 | $187,900 |
| 2015 | $5,561 | $242,300 | $51,700 | $190,600 |
| 2014 | $5,561 | $242,300 | $51,700 | $190,600 |
Map
- 85 Hilton Ave
- 108 Hilton Ave
- 76 Beverly Rd
- 65 Ferncrest Dr
- 38 Franklin St
- 57 Park Dr
- 35 Great Rd
- 45 Metropolitan Park Dr
- 49 Metropolitan Park Dr
- 210 Promenade St
- 1 Pinehurst Rd
- 26 Peach Orchard Dr
- 13 Peach Orchard Dr
- 119 Rounds Ave Unit 121
- 18 Glen St
- 134 Rogers Ave
- 714 Willett Ave
- 41 Rogers Ave
- 27 Monmouth Dr
- 145 Oak Crest Dr Unit 147
Ask me questions while you tour the home.