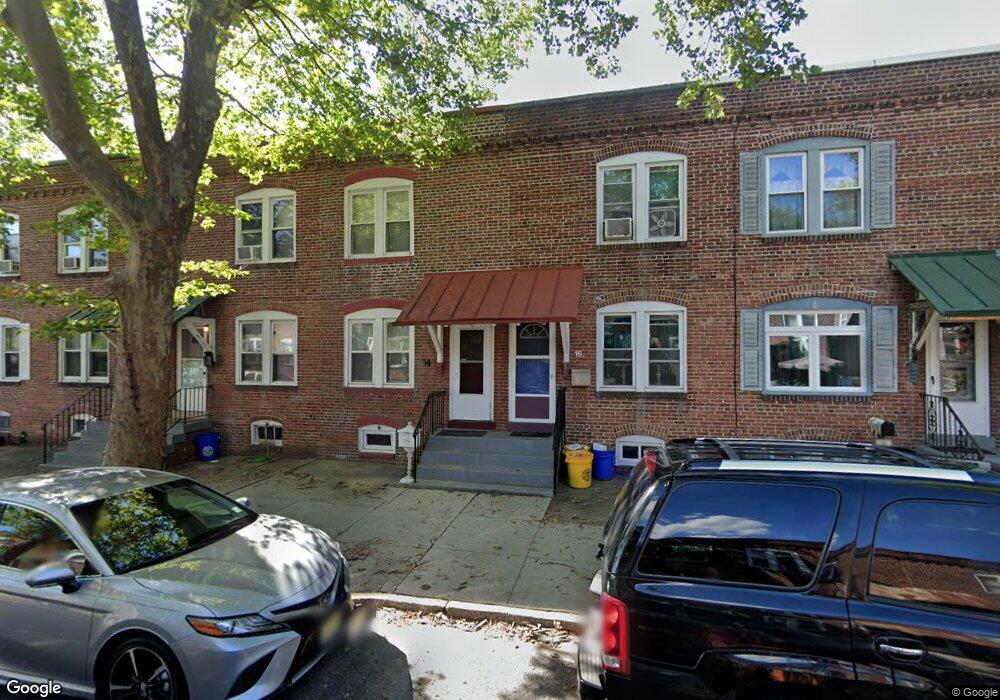
16 Amboy Ave Roebling, NJ 08554
Estimated Value: $205,000 - $214,000
--
Bed
--
Bath
990
Sq Ft
$212/Sq Ft
Est. Value
About This Home
This home is located at 16 Amboy Ave, Roebling, NJ 08554 and is currently estimated at $210,068, approximately $212 per square foot. 16 Amboy Ave is a home located in Burlington County with nearby schools including Number 5, Roebling Elementary School, Riverfront Middle School, and Florence Twp Mem High School.
Ownership History
Date
Name
Owned For
Owner Type
Purchase Details
Closed on
May 31, 2022
Sold by
Franklin Family Living Trust
Bought by
Franklin Melissa Alexandra
Current Estimated Value
Purchase Details
Closed on
Jun 18, 2015
Sold by
Franklin Malcolm G and Franklin Susan C
Bought by
Franklin Family Living Trust and Franklin Susan C
Purchase Details
Closed on
Apr 27, 2011
Sold by
Franklin Susan C and Franklin Malcolm G
Bought by
Franklin Malcolm G and Franklin Susan C
Home Financials for this Owner
Home Financials are based on the most recent Mortgage that was taken out on this home.
Original Mortgage
$70,000
Interest Rate
4.15%
Mortgage Type
New Conventional
Purchase Details
Closed on
Nov 18, 2005
Sold by
Vierling William
Bought by
Franklin Susan C
Home Financials for this Owner
Home Financials are based on the most recent Mortgage that was taken out on this home.
Original Mortgage
$56,000
Interest Rate
5.7%
Mortgage Type
Fannie Mae Freddie Mac
Purchase Details
Closed on
Oct 10, 2000
Sold by
Young Patrick H
Bought by
Kafer Bruce D
Create a Home Valuation Report for This Property
The Home Valuation Report is an in-depth analysis detailing your home's value as well as a comparison with similar homes in the area
Home Values in the Area
Average Home Value in this Area
Purchase History
| Date | Buyer | Sale Price | Title Company |
|---|---|---|---|
| Franklin Melissa Alexandra | -- | Serinese Lisa | |
| Franklin Family Living Trust | -- | Attorney | |
| Franklin Malcolm G | -- | Service Link | |
| Franklin Susan C | $126,000 | None Available | |
| Kafer Bruce D | $29,500 | -- |
Source: Public Records
Mortgage History
| Date | Status | Borrower | Loan Amount |
|---|---|---|---|
| Previous Owner | Franklin Malcolm G | $70,000 | |
| Previous Owner | Franklin Susan C | $56,000 |
Source: Public Records
Tax History Compared to Growth
Tax History
| Year | Tax Paid | Tax Assessment Tax Assessment Total Assessment is a certain percentage of the fair market value that is determined by local assessors to be the total taxable value of land and additions on the property. | Land | Improvement |
|---|---|---|---|---|
| 2025 | $2,837 | $101,800 | $40,000 | $61,800 |
| 2024 | $2,716 | $101,800 | $40,000 | $61,800 |
| 2023 | $2,716 | $101,800 | $40,000 | $61,800 |
| 2022 | $2,658 | $101,800 | $40,000 | $61,800 |
| 2021 | $2,635 | $101,800 | $40,000 | $61,800 |
| 2020 | $2,624 | $101,800 | $40,000 | $61,800 |
| 2019 | $2,601 | $101,800 | $40,000 | $61,800 |
| 2018 | $2,579 | $101,800 | $40,000 | $61,800 |
| 2017 | $2,547 | $101,800 | $40,000 | $61,800 |
| 2016 | $2,498 | $101,800 | $40,000 | $61,800 |
| 2015 | $2,447 | $101,800 | $40,000 | $61,800 |
| 2014 | $2,788 | $119,300 | $40,000 | $79,300 |
Source: Public Records
Map
Nearby Homes